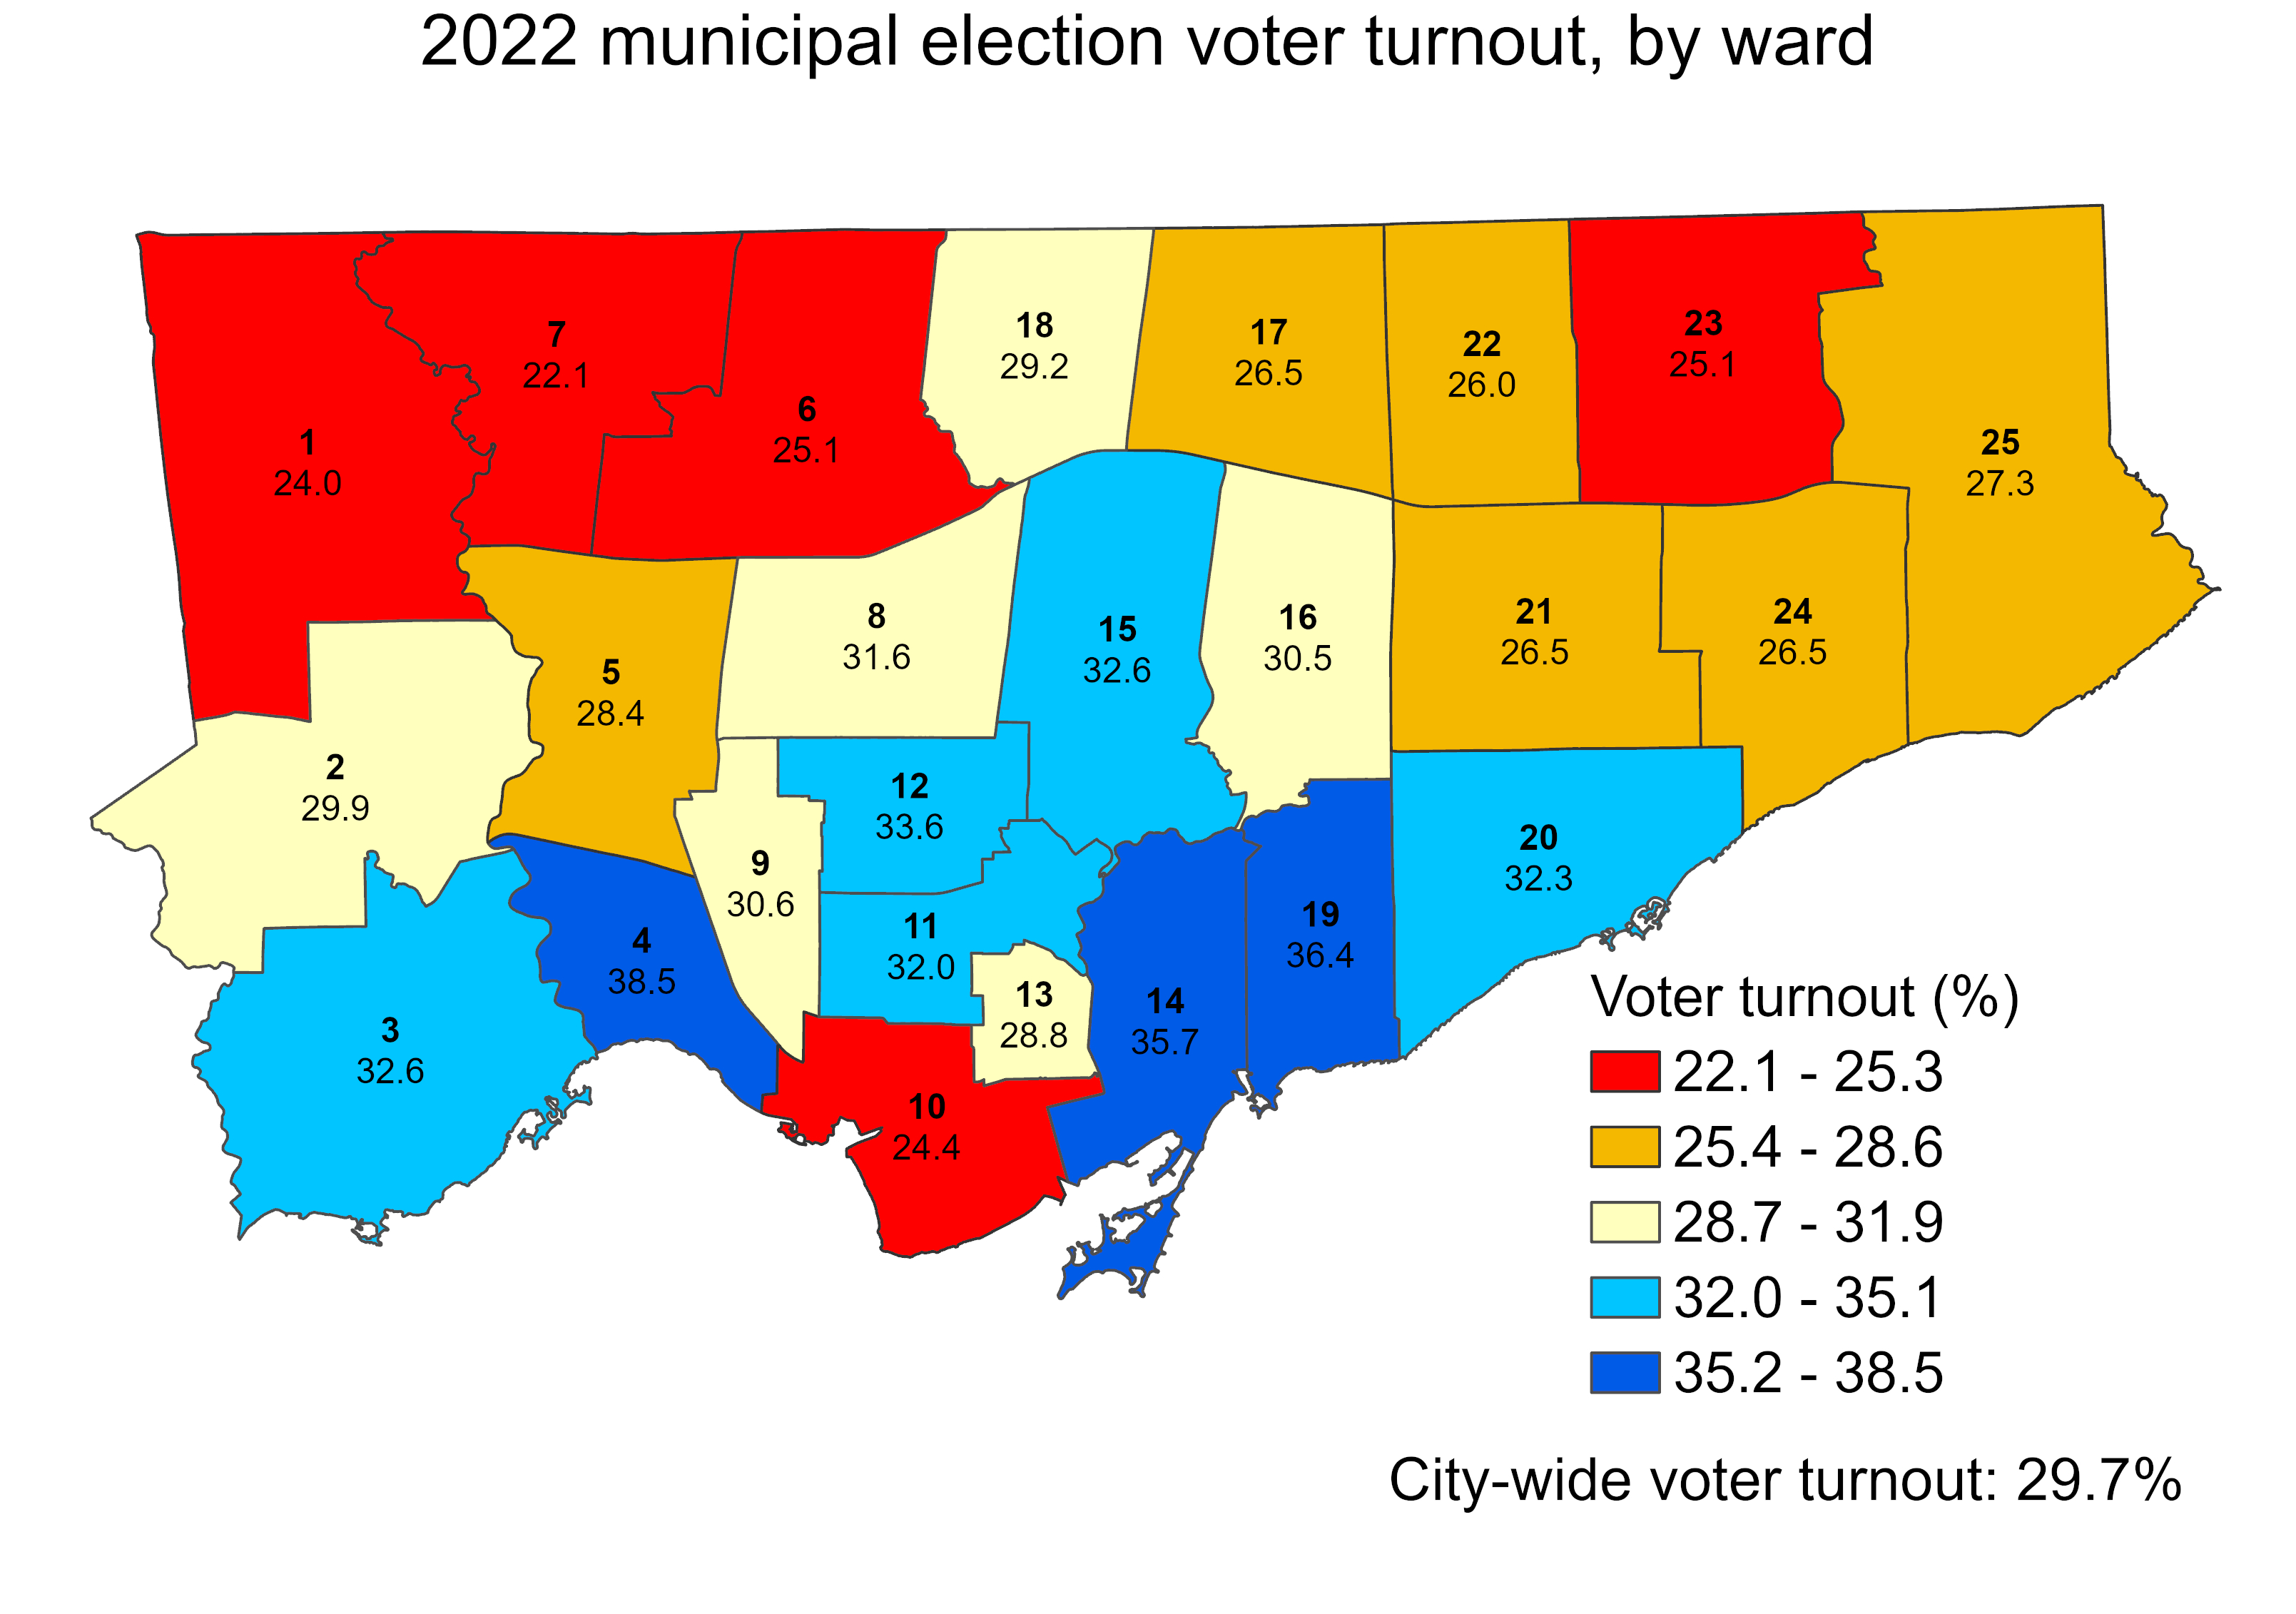
Ever since John Tory was elected mayor of Toronto in 2014, voter turnout in municipal elections has been in decline. In 2010, the year Rob Ford was elected mayor, turnout was 50.4 percent. Four years later, 54.7 percent of all eligible voters went to the polls to elect a new chief magistrate. However, in 2018, just 40.9 percent bothered to vote, and in 2022, turnout fell further, to just 29.7 percent.
With the recent release of detailed voter statistics from the 2022 municipal election in the Toronto Open Data catalogue, it is now possible to see how much turnout dropped in each ward.
I dig deeper into the last election’s dismal showing, and what it might mean for the upcoming mayoral by-election, at Spacing Toronto.
How Toronto voted for mayor. Areas shaded in blue represent electoral subdivisions (polls) where John Tory placed first. Areas shaded in purple represent polls where Gil Penalosa placed first. Click here for the interactive version.
As has become my tradition after Toronto’s municipal elections, I mapped out the poll-by-poll results of the mayoral race and some of the more interesting council races. After creating maps for the 2014 election and sharing those on social media, it was suggested that I have a website to host these maps. That is how this website came to be.
This time, I created an interactive map showing the results of the mayoral race, along with six council races: Ward 3 Etobicoke-Lakeshore, Ward 4 Parkdale High-Park, Ward 5 York South-Weston, Ward 11 University-Rosedale, Ward 18 Willowdale, and Ward 20 Scarborough Southwest.
This coming Monday, October 24, Ontarians will be electing new city councils. In Brampton, Ottawa, and Hamilton, the mayoral races should prove to be interesting. For Ottawa in particular, with Jim Watson stepping down, voters have a clear choice (and I’ll be cheering for Catherine McKenney). Though Gil Penalosa offers a new vision of a sustainable, active, and safer city, it’s very likely John Tory will win an unprecedented third term, the first to do so since amalgamation in 1998.
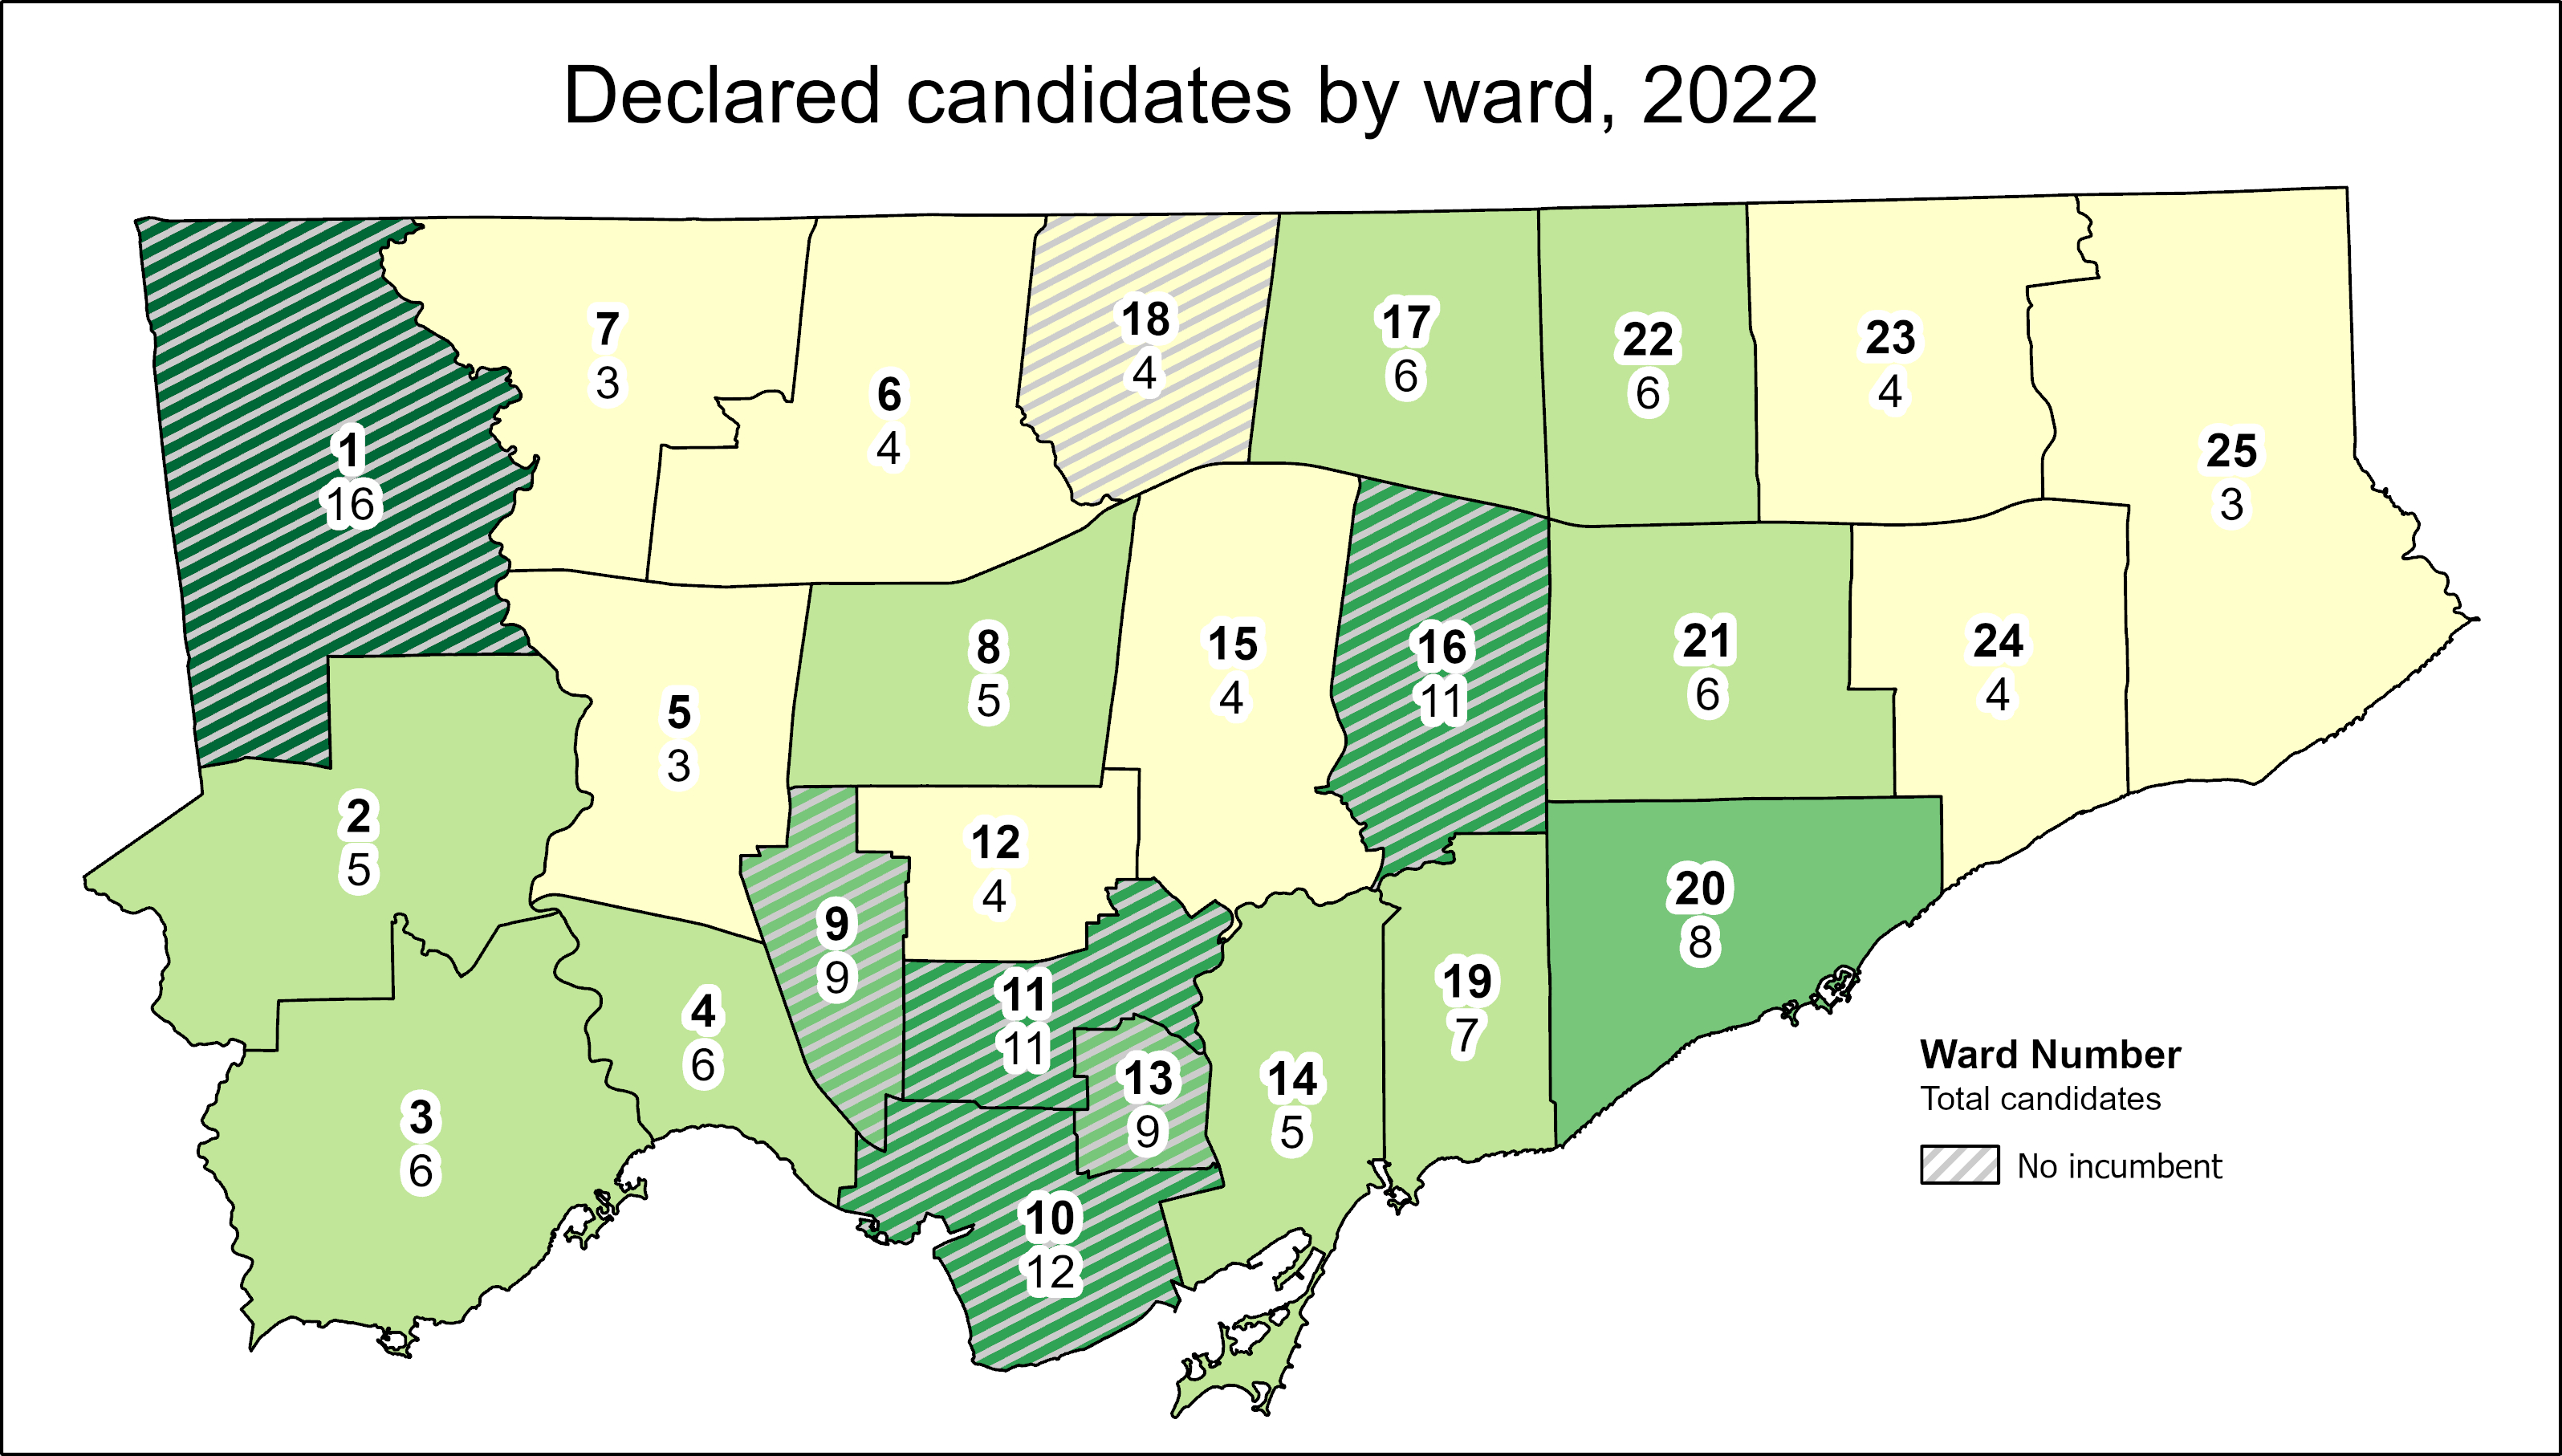
At Spacing Toronto, I have been offering some insights by mapping the state of our local democracy, ward by ward. Though there are seven wards in which no sitting councillor is running for re-election, the new council may not look too much different from the last one. That’s because two former councillors — Vincent Crisanti and Jon Burnside — will be looking to get back into office. Meanwhile, Mayor Tory has been busy campaigning for twelve candidates, including eight incumbents, that will help advance his agenda of incrementalism and austerity. Among Tory’s picks are Frances Nunziata, who has been in municipal office uninterrupted since 1988.
Here are the links to my posts at Spacing:
Open wards and the power of incumbency: The power of incumbency, and the mayor’s own influence, will weigh heavy on the final results. Though there may be seven “open” wards and a few more truly-competitive races, there is a lot happening behind the scenes to favour certain candidates.
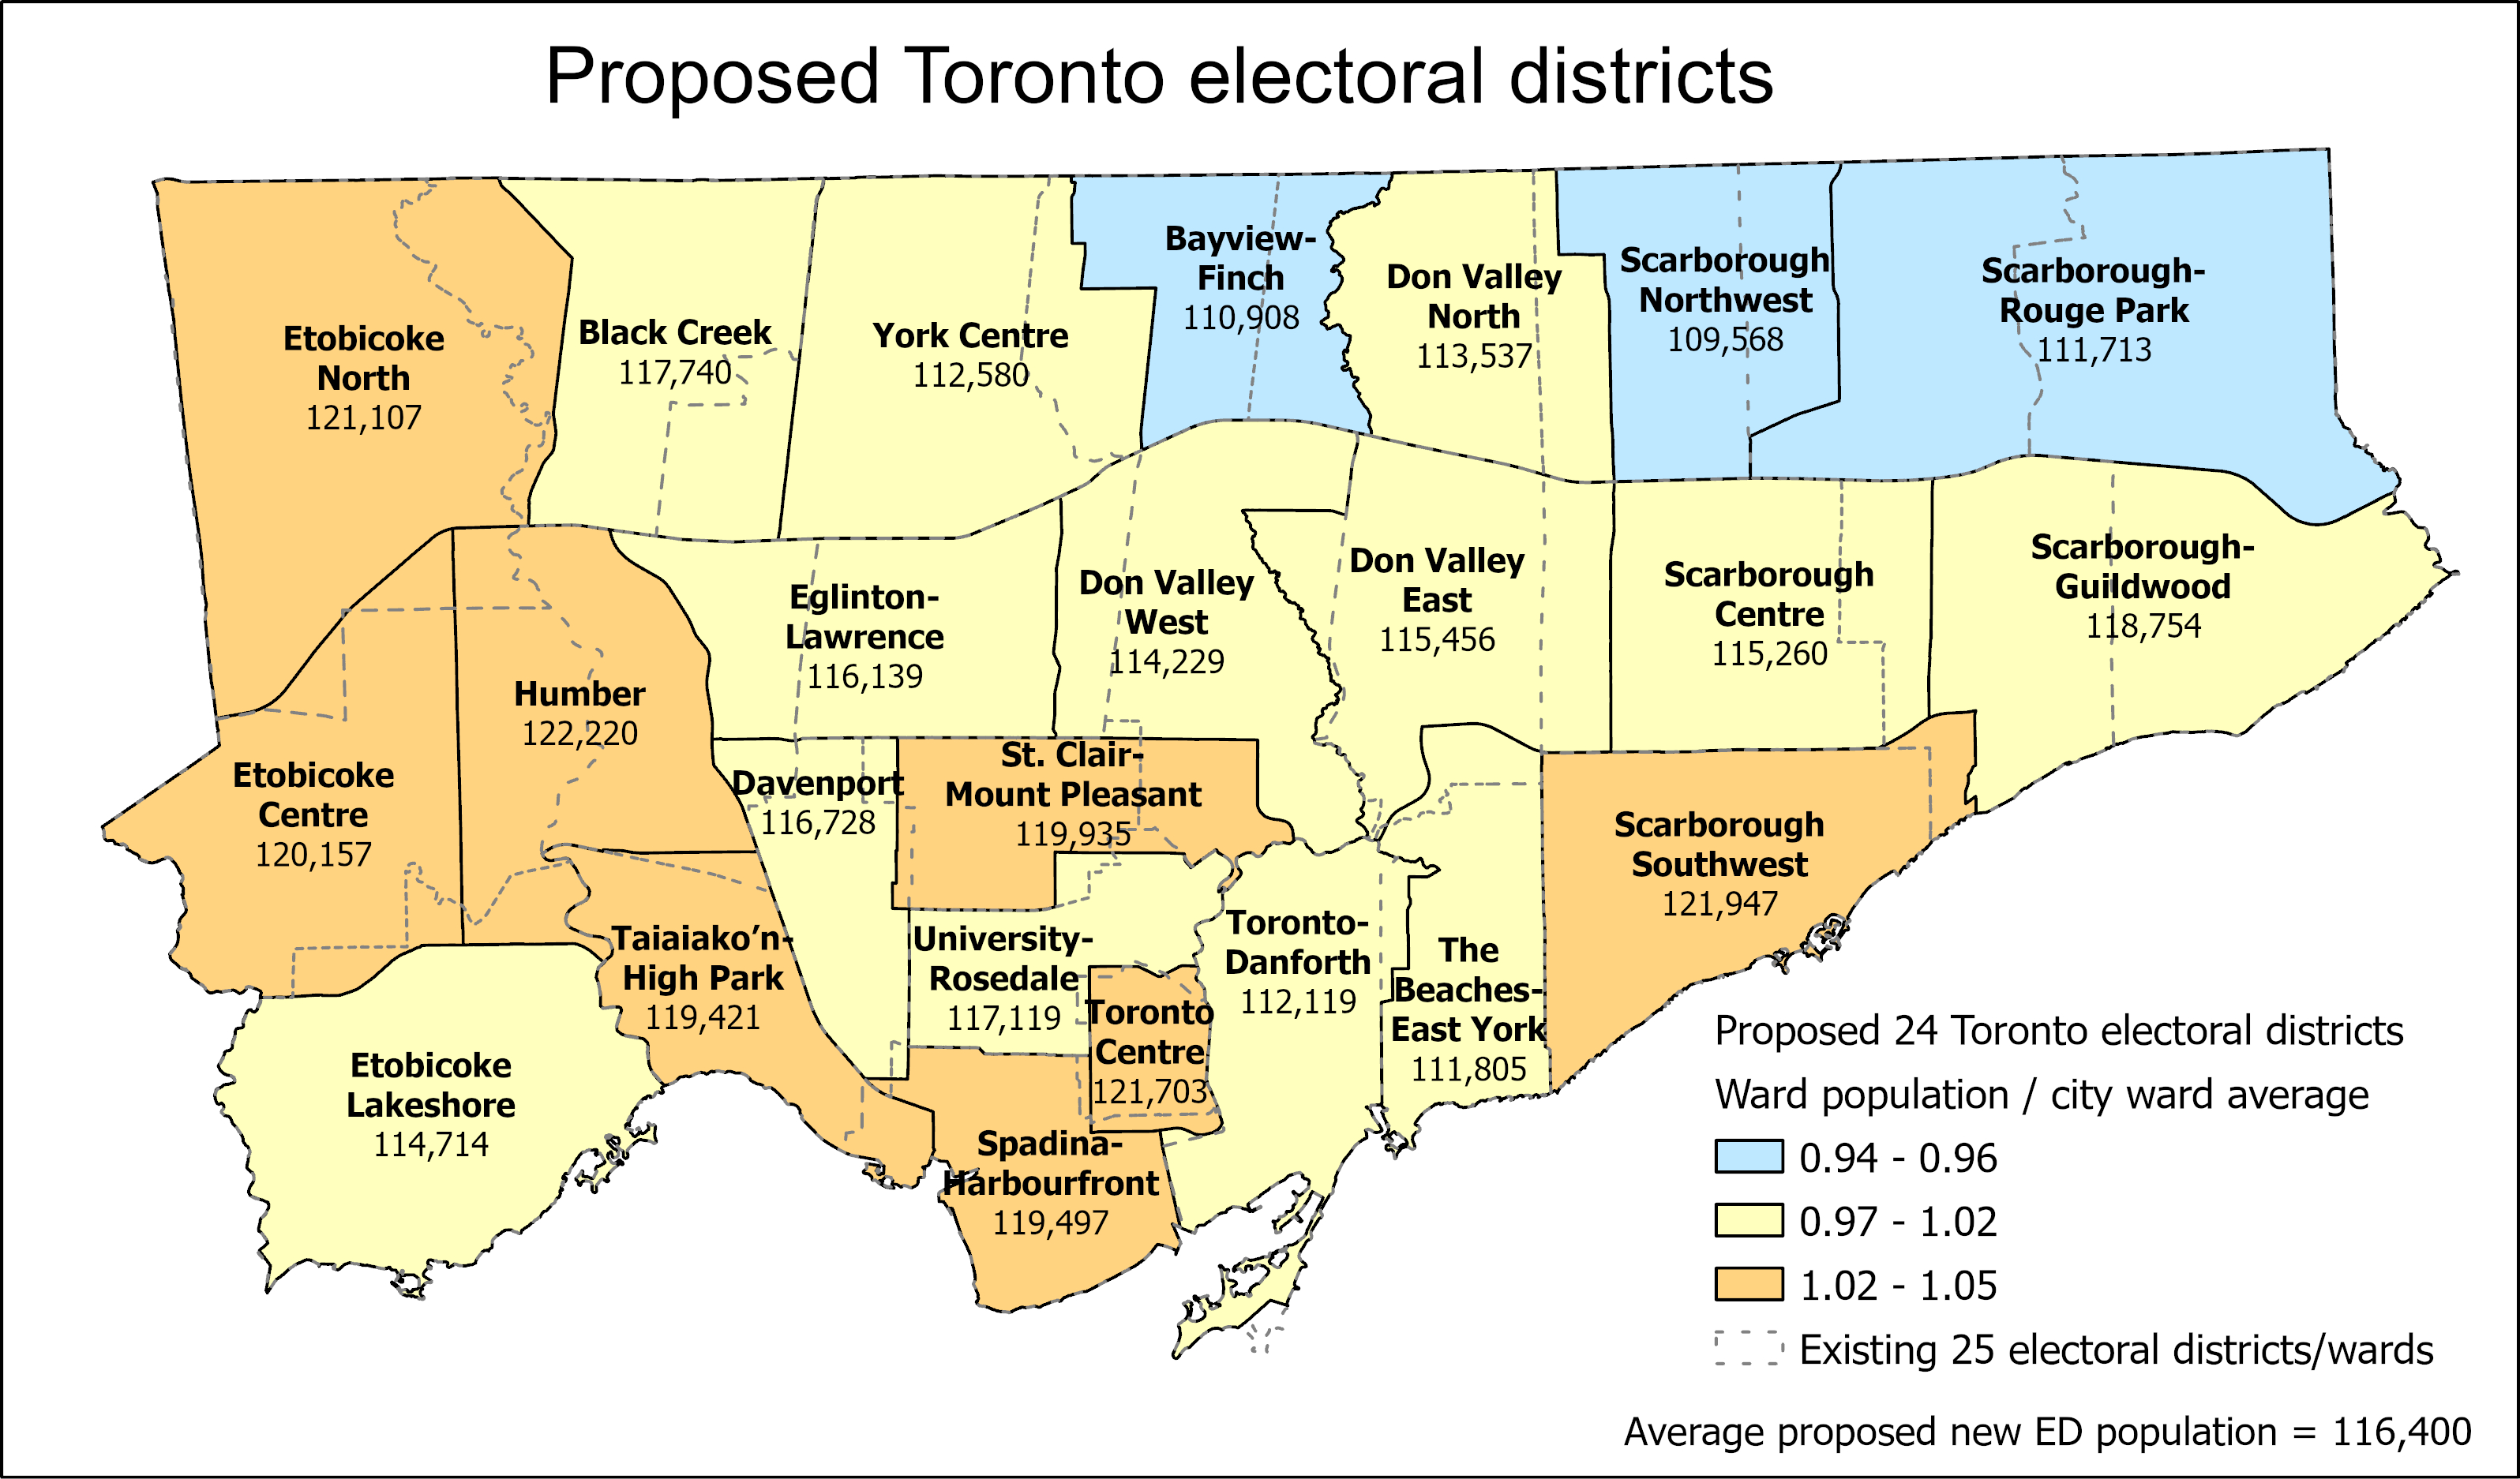
Population disparities between Toronto’s 25 wards: How ward boundaries that were drawn in 2013 have exasperated imbalances in population, leading to burnout in high-growth wards (with several downtown councillors deciding to move on). If Toronto continues to be forced to use federal/provincial riding boundaries, it will have just 24 wards in the 2026 election.
What Toronto’s new ward boundaries might look like
Toronto is a highrise, rental city – unlike City Council: Though nearly half of all Torontonians live in highrise dwellings and/or rent their homes, Toronto City Council is made up almost entirely of homeowners. In only a few wards, detached houses make up the vast majority of the housing stock and homeowners dominate. I ask why city council doesn’t reflect the way an increasing number of us live. The interest in this post had me on CBC Metro Morning for the first time, early on September 30.
Duelling campaign endorsements: Though Mayor John Tory has supported a few candidates before (most notably, Etobicoke councillor Mark Grimes), this time, he’s actively campaigning with twelve allies. Meanwhile Progress Toronto is backing nine challengers, focusing on races where it hopes to help get new faces elected.
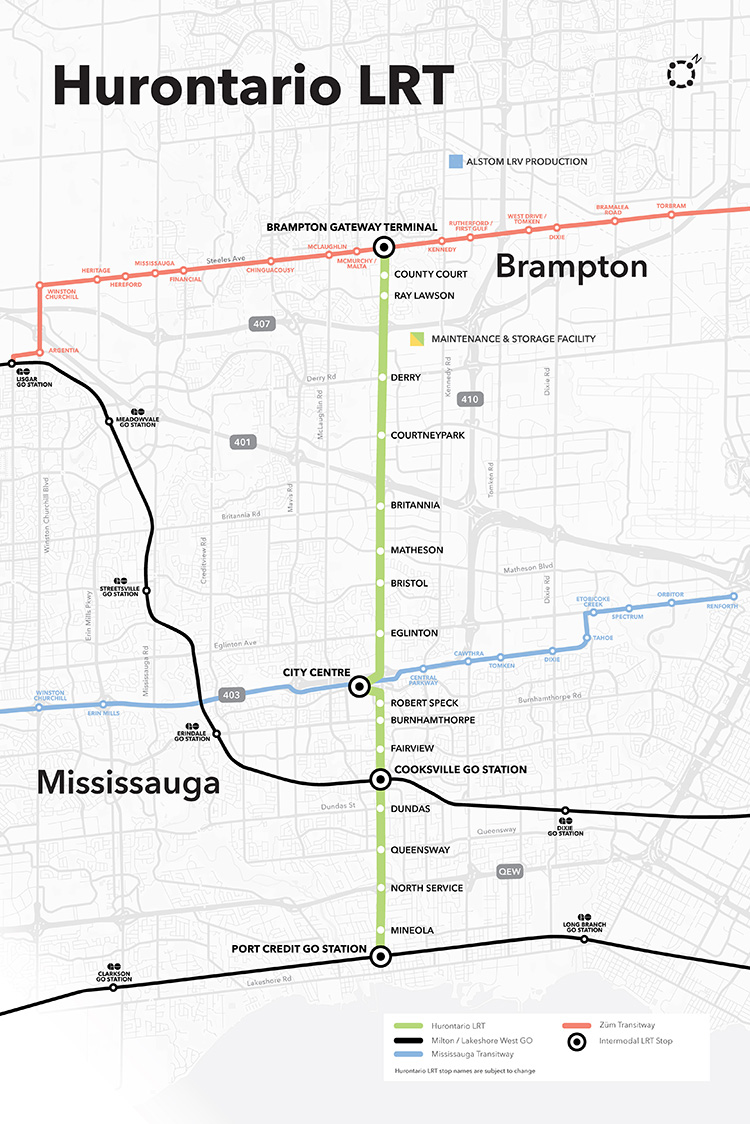
On Monday, February 14, Premier Doug Ford, Transportation Minister Carolyn Mulroney, and Mississauga Mayor Bonnie Crombie attended a photo-op at Cooksville GO Station to announce a new name for a transit project. With former mayor Hazel McCallion in attendance (who was celebrating her 101th birthday), it was no secret what the new name was going to be.
It was disappointing that the Hurontario LRT, a provincially-funded transit project operating within Brampton and Mississauga and intended to be part of a regional transportation network, would be named for a divisive former mayor of only one of the two cities the Hurontario LRT is supposed to directly benefit.
In North America, and around the world, transit lines and stations are named (with a few misguided exceptions) to reflect the geography of the route it represents and to provide optimal wayfinding, especially to visitors and people new to transit. In Greater Toronto, bus, streetcar, commuter rail and subway routes are named based on the major street they run on (the 501 Queen Streetcar or Line 4 Sheppard), the neighbourhood they serve (the 56 Leaside bus) or the destination it runs to (the GO Milton Line or 900 Airport Express).
Even new projects follow these conventions. The Crosstown LRT, which operates under and along Eglinton Avenue, is a crosstown route across the middle of the city. Even the Ontario Line partially gets its name from its two end points (Exhibition Place/Ontario Place and Ontario Science Centre). The Hurontario LRT reflected the name of the main street it operates along, even if it changes its name briefly though central Brampton.
The “Hazel McCallion Line” does not accomplish any of these goals.
Given Peel Region’s diverse population of over 1.4 million residents, it is also disappointing that a major project intended to unite the region is named for an affluent white public figure that already has two libraries, a public school and a college campus already bearing her name.
I suspect Premier Ford wanted to celebrate a political ally a few months before the next provincial election, but naming the Hurontario LRT after Hazel McCallion sends the wrong message.
Post script: The Hurontario Line may not be the only Metrolinx transit facility that will see its name change. In a MERX posting dated February 15, 2022, Metrolinx is looking for Expressions of Interest for station naming rights opportunities for at least four existing GO Transit rail stations. The summary is quoted below:
Expression of Interest
Expression of Interest No. RFI-2021-CCMX-097
Metrolinx is accepting Expressions of Interest for Station Naming Rights Opportunity.
Metrolinx is an agency of the Government of Ontario, overseeing GO Transit, PRESTO, and UP Express. We are embarking on a massive transformation of the GO Rail network – the backbone of regional rapid transit in the region – to give customers a faster, more convenient way to connect with the things that matter.
Metrolinx is seeking proposals from interested parties in any category for the Station Naming Rights Opportunity at the following stations:
Whitby GO Station Exhibition GO Station Clarkson GO Station Oakville GO Station
Metrolinx will consider proposals for other stations not listed here at the request of interested parties.
For more information about the GO Transit network and stations, please visit www.gotransit.com. We are committed to working together to create a partnership that will meet shared objectives, such as increase revenue, increase market share for our partners and provide a positive customer experience on public transit.
All four stations listed are on the Lakeshore Line, the backbone of the GO Transit rail network. Exhibition GO could be especially attractive for renaming, as it will become a major hub with the future connection to the Ontario Line and local TTC services. It is also worth noting that Metrolinx will entertain proposals for additional stations in the bid process.
It is hard to blame Metrolinx for these specific transit naming decisions; it is very likely that the Ford government demanded the McCallion Line and is pushing for the sell-off of naming rights. But it is ironic that after hiring consultants and going though a complex naming process for the Crosstown LRT, that previously held principles are quickly abandoned at the whim of Metrolinx’s superiors.
When Statistics Canada released the first batch of 2021 Census data, it made the new population counts available for a wide variety of geographies, from provinces and cities, to local census tracts and even city blocks. It also released data for the 338 federal electoral districts, better known as ridings.
Because of constitutional requirements, the seats in the federal House of Commons are not allocated equally by population. For example, Prince Edward Island, with a population of 154,331, has four seats. At the other extreme, four electoral districts in Alberta and one in Brampton, Ontario have larger populations than Canada’s smallest province.
Electoral District
Province/Territory
2021 Population
Labrador
Newfoundland & Labrador
26,655
Egmont
Prince Edward Island
35,925
Nunavut
Nunavut
36,858
Charlottetown
Prince Edward Island
38,809
Malpeque
Prince Edward Island
39,731
Average
109,444
Banff-Airdrie
Alberta
155,580
Calgary Skyview
Alberta
159,642
Brampton West
Ontario
162,353
Calgary Shepard
Alberta
163,447
Edmonton-Wetaskiwin
Alberta
209,431
The federal electoral districts were last drawn in 2013, following the 2011 census. As a result, fast-growing ridings, particularly in Southern Ontario, Calgary, and Edmonton, have huge populations compared to the national average.
In Ontario, the provincial government uses the same boundaries for its provincial electoral districts, with the exception of Northern Ontario, where two additional seats help to compensate for the area’s vast and remote regions, where local MPPs may have to travel hours by car, train, or plane to meet constituents. The province imposed the same boundaries on the City of Toronto in 2018, in the middle of a municipal election for which new, fairer boundaries were just approved.
By 2021, the population differences based on decade-old data became stark, as shown in the map below.
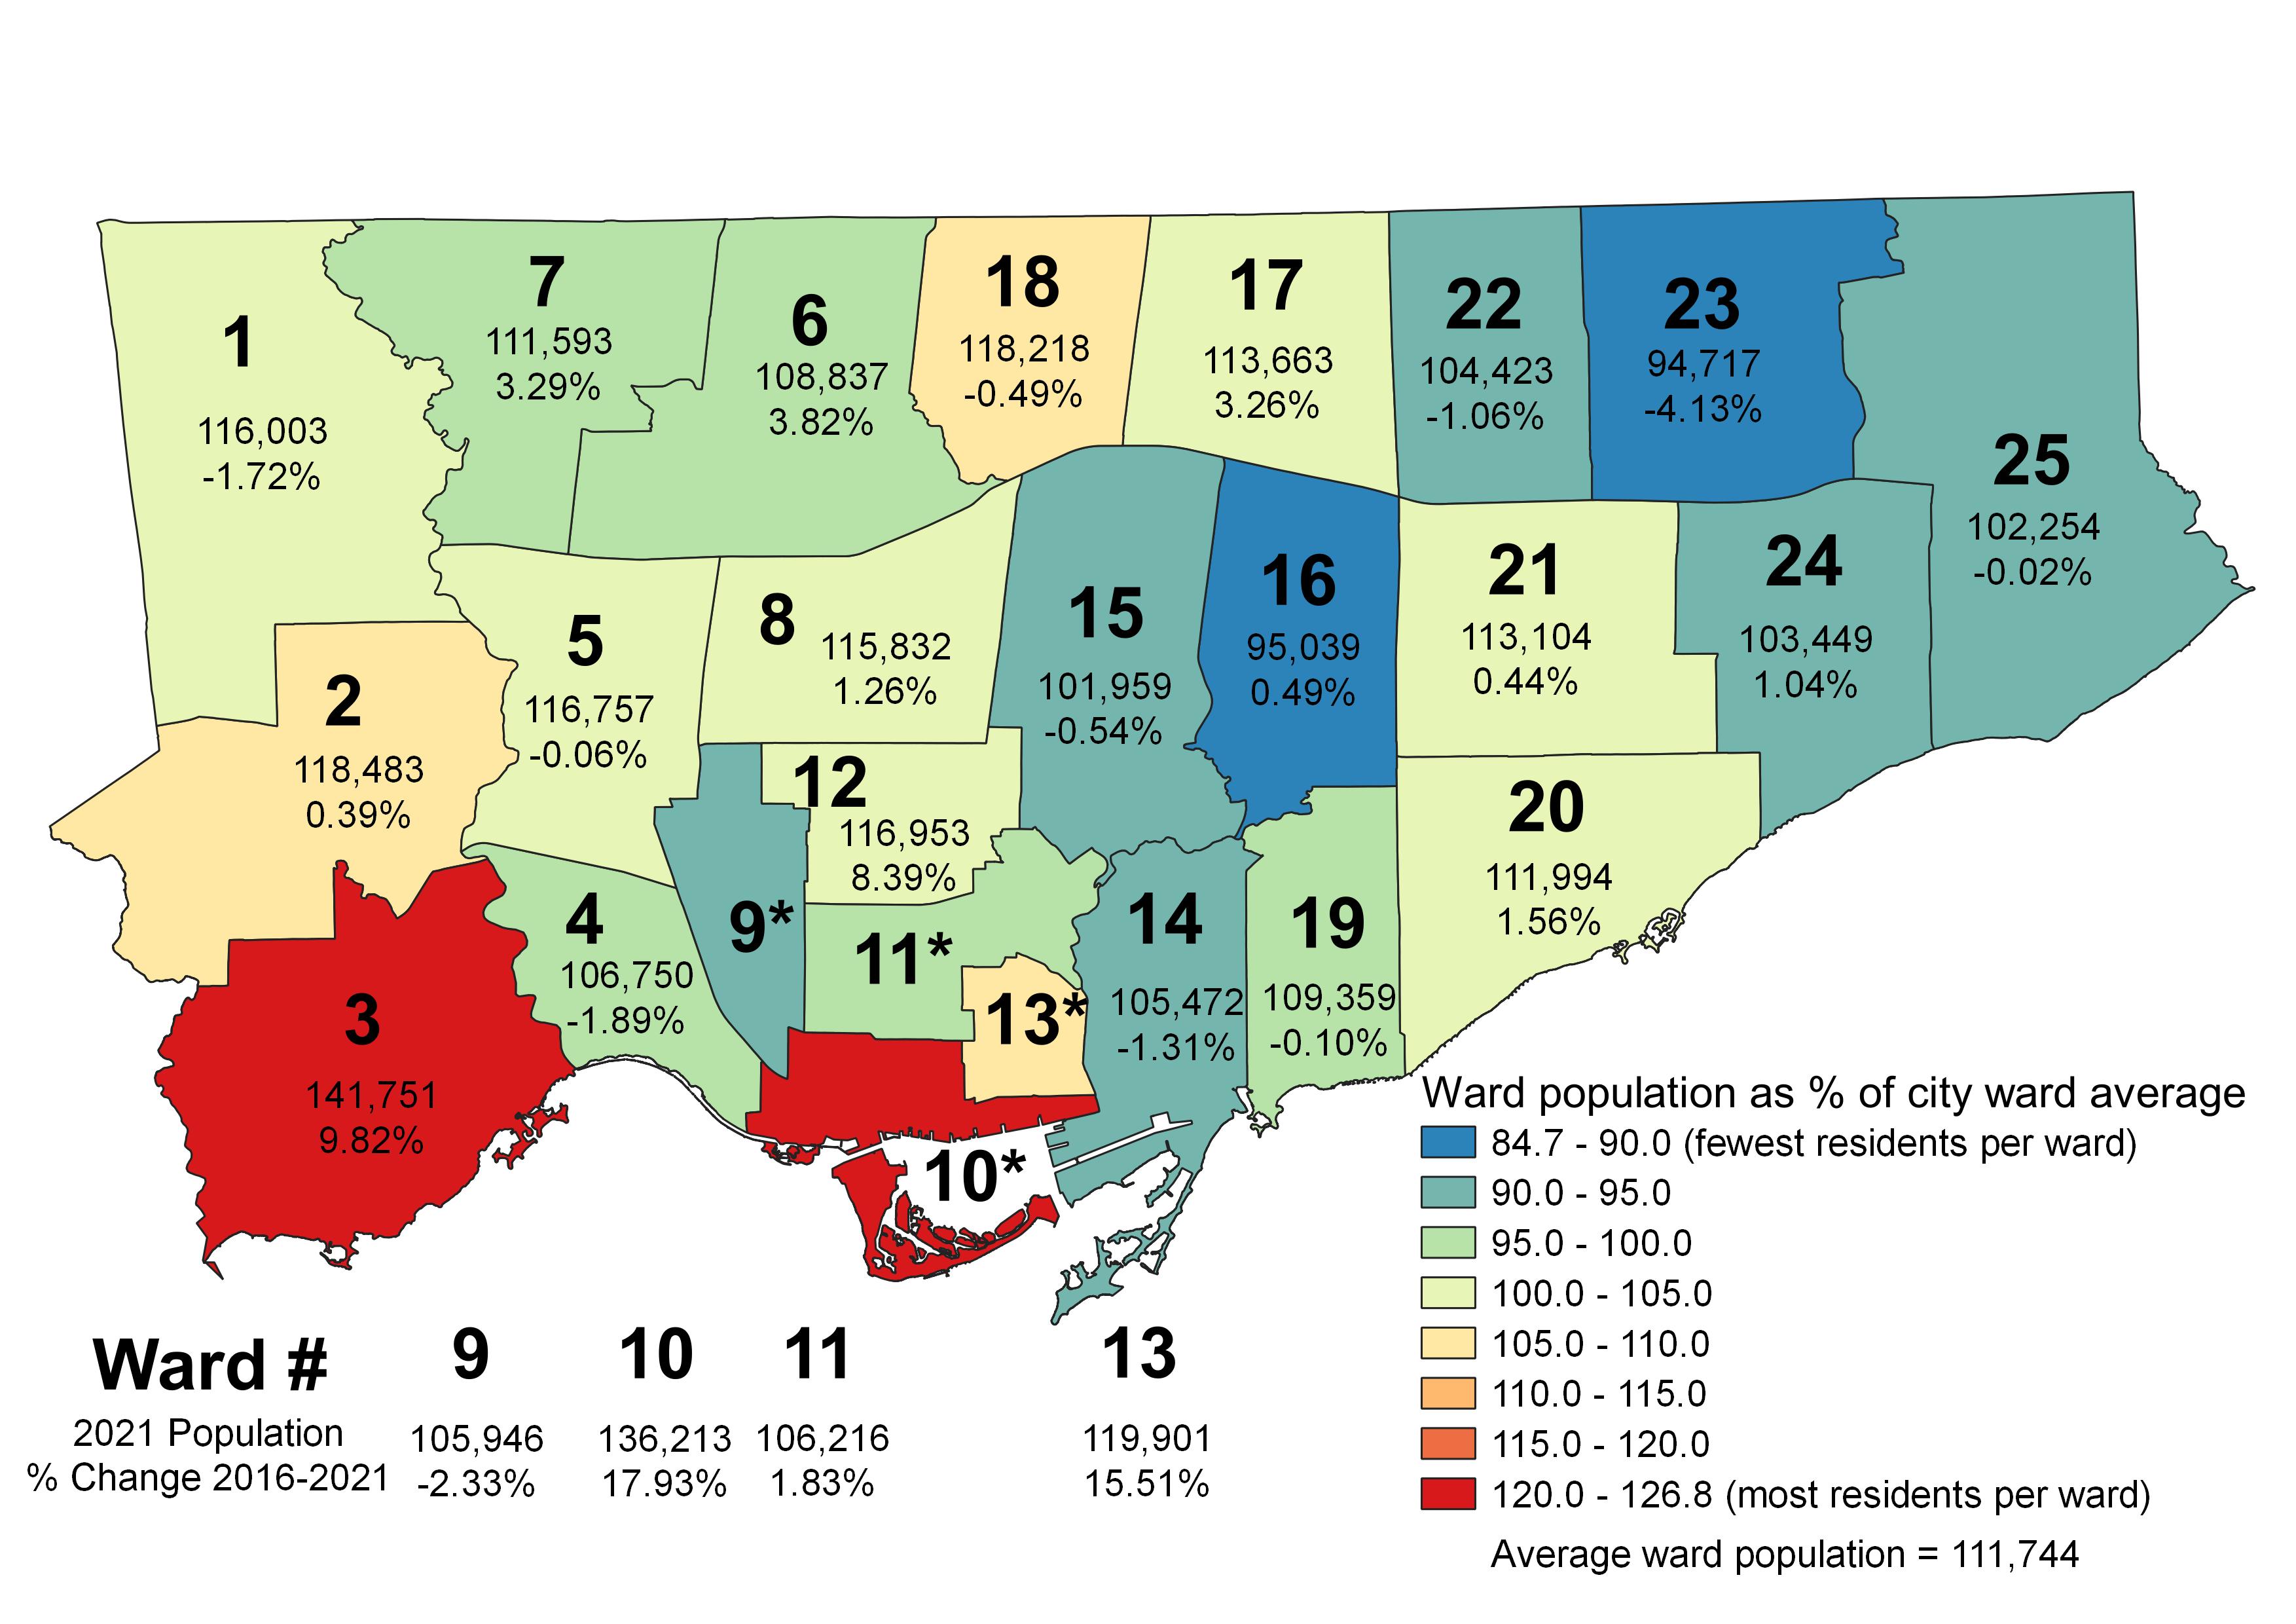
Map depicting disparities in Toronto’s ward populations
Ward 23 Scarborough North, represented by Cynthia Lai, has a population of 94,717. Ward 23’s population dropped by over 4% since 2016, as households age and few new housing units built in that ward. Ward 16, Don Valley East, has just 95,039 residents, with a stable population.
On the other extreme, Ward 3 Etobicoke-Lakeshore, represented by veteran councillor Mark Grimes, has a population of 141,751, growing by 9.82% since 2016. New condominium developments in the Humber Bay neighbourhood and along the Queensway have driven much of that growth. Ward 10, Spadina-Fort York, saw an even greater number of new residents move in, growing by nearly 18% in the last five years.
As Toronto is stuck with these ward boundaries until 2026, the population disparities will only grow larger, with downtown and South Etobicoke residents becoming even more underrepresented. Compounding the unfairness is that councillors representing high-growth wards have much higher workloads, as they deal with mountains of planning applications while ensuring their existing constituents have access to essential local services like schools, transit, and park space.
The ward boundaries initially set for the 2018 municipal election would have accounted for future growth, ensuring that workloads would be more fairly distributed, and that city residents would have equal access to their local councillor.
The 2021 population counts will be used to set new federal riding boundaries, which will be drawn next year after a consultation period and used in the first federal election held after 2023. The province will likely adopt the new boundaries for the 2026 election (assuming a majority government is elected in June).
Perhaps in four years, Toronto will be able to set its own ward boundaries again. That, of course, will depend on electing a better provincial government and a council committed to equity and good governance.