On February 9, data geeks across Canada rejoiced when Statistics Canada released the first round of data from the 2021 Census of the Population.
The data was released at all levels of geography made available by Statscan. At the federal level, Canada grew by 5.2% since the 2016 Census, with a total population of 36,991,981. Immigration, rather than natural growth (births vs. deaths) drove Canada’s population increase.
Of course, this growth did not occur evenly across the country. Newfoundland and Labrador lost residents, while Prince Edward Island and British Columbia saw the biggest population increases.
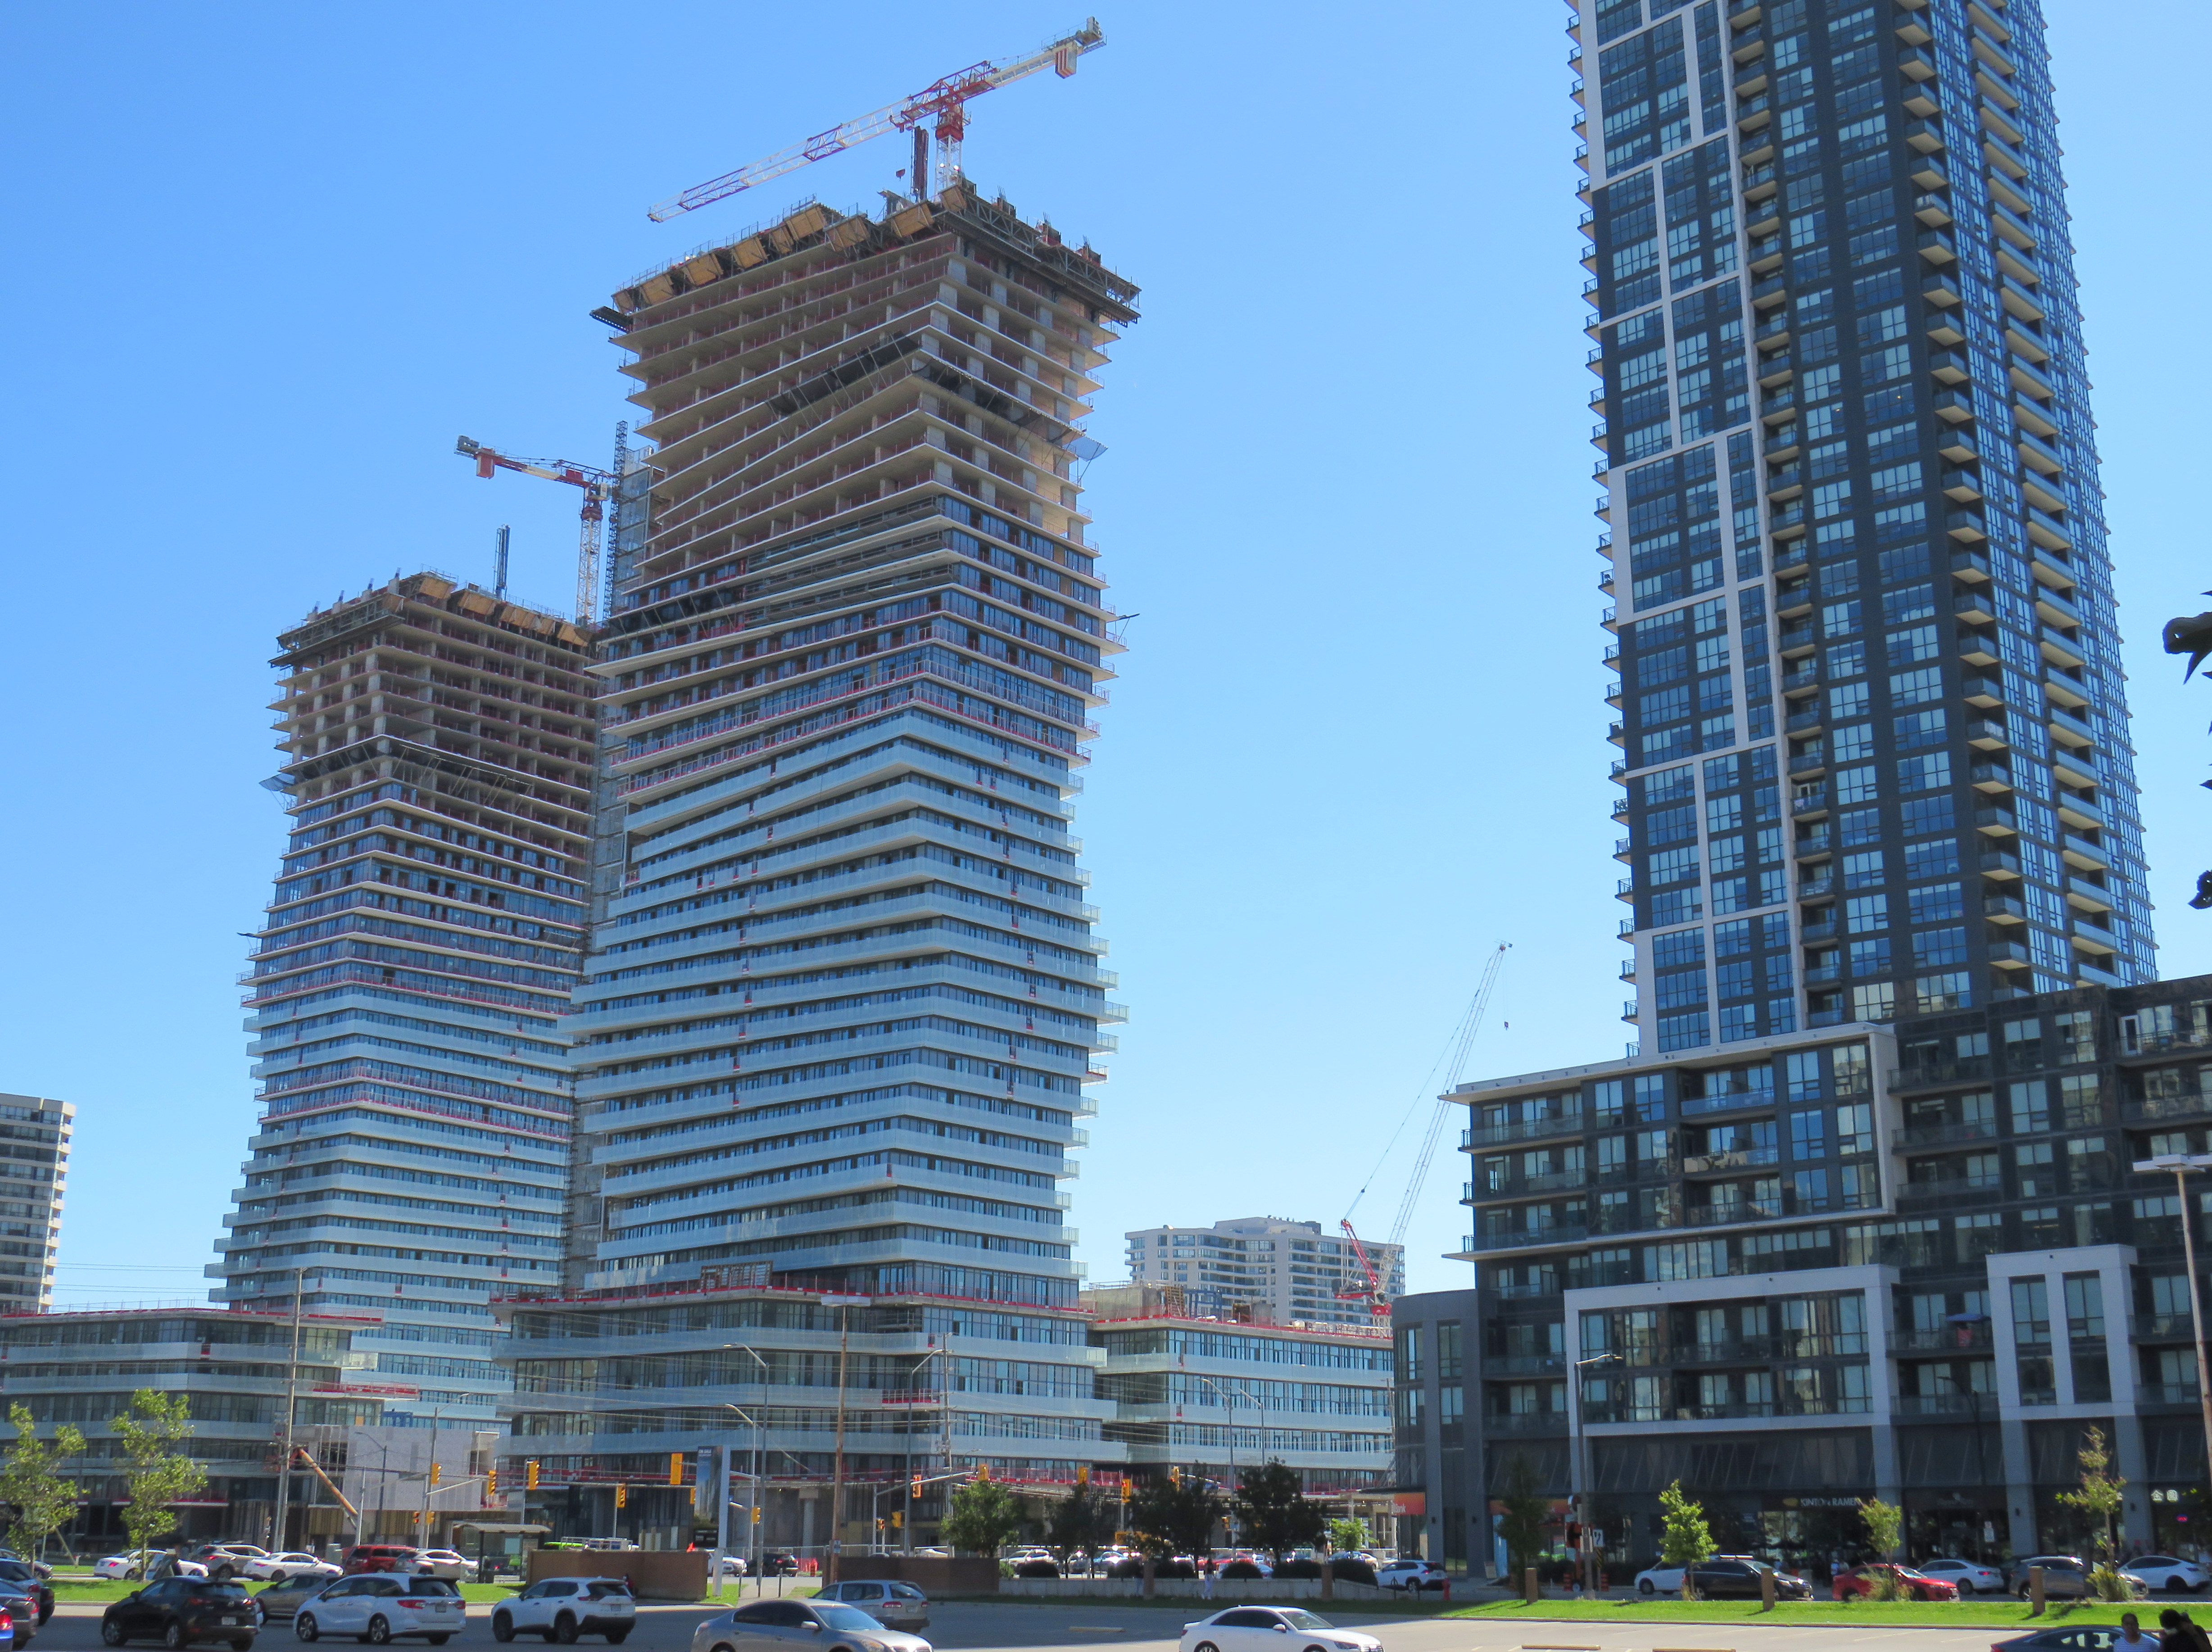
Within the Greater Toronto and Hamilton Area, Mississauga experienced population decline (-0.5%) for the first time since it became a city in 1974. Outer suburbs, such as Milton, East Gwillimbury, and areas just beyond the GTHA, such as New Tecumseth and Bradford saw population growth over 20%, driven by new greenfield development.
In older Toronto suburbs, including much of Etobicoke, North York, Scarborough, and even Mississauga, population losses at the local census tract level can be explained by ageing households, where Millennial and older Gen Z children moved out on their own, particularly into fast-growing downtown areas. These areas, dominated by single-family housing, could accommodate much of the GTHA’s growth with gentle density, including secondary suites (such as basement apartments), garden suites, and zoning policies that would make it easier and more economical to build “missing middle” housing such as walkup apartments and multiplex homes.
Toronto grew by 62,785 residents in the last five years, with only a few areas accommodating all that growth: the downtown core between Dufferin Street and Broadview Avenue, South Etobicoke, Yonge-Eglinton, and former industrial, instructional, and commercial lands stretching along the Highway 401 corridor through North York and West Scarborough. This corridor includes the Downsview Park development, a new condominium cluster at Wilson Subway Station, the former Canadian Tire lands near Sheppard Avenue and Leslie Street, and the intensification of the Fairview Mall area.
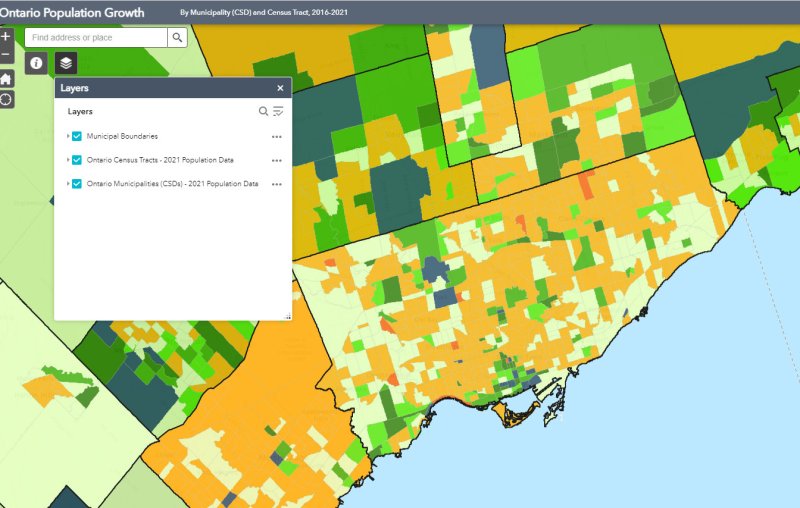
You can take a look at the changes for each municipality and each census tract in Ontario with an interactive map I created here.
Population Change for GTHA Municipalities
| Municipality | 2021 Population | 2016 Population | Change (%) | Change (Total) |
|---|---|---|---|---|
| Toronto | 2,794,356 | 2,731,571 | 2.3 | 62,785 |
| Mississauga | 717,961 | 721,599 | -0.5 | -3,638 |
| Brampton | 656,480 | 593,638 | 10.6 | 62,842 |
| Hamilton | 569,353 | 536,917 | 6.0 | 32,436 |
| Markham | 338,503 | 328,966 | 2.9 | 9,537 |
| Vaughan | 323,103 | 306,233 | 6.0 | 16,870 |
| Oakville | 213,759 | 193,832 | 10.3 | 19,927 |
| Richmond Hill | 202,022 | 195,022 | 3.6 | 7,000 |
| Burlington | 186,948 | 183,314 | 2.0 | 3,634 |
| Oshawa | 175,383 | 159,458 | 10.0 | 15,925 |
| Whitby | 138,501 | 128,377 | 7.9 | 10,124 |
| Milton | 132,979 | 110,128 | 20.7 | 22,851 |
| Ajax | 126,666 | 119,677 | 5.8 | 6,989 |
| Clarington | 101,427 | 92,013 | 10.2 | 9,414 |
| Pickering | 99,186 | 91,771 | 8.1 | 7,415 |
| Newmarket | 87,942 | 84,224 | 4.4 | 3,718 |
| Caledon | 76,581 | 66,502 | 15.2 | 10,079 |
| Halton Hills | 62,951 | 61,161 | 2.9 | 1,790 |
| Aurora | 62,057 | 55,445 | 11.9 | 6,612 |
| Whitchurch-Stouffville | 49,864 | 45,837 | 8.8 | 4,027 |
| Georgina | 47,642 | 45,418 | 4.9 | 2,224 |
| East Gwillimbury | 34,637 | 23,991 | 44.4 | 10,646 |
| King | 27,333 | 24,512 | 11.5 | 2,821 |
| Scugog | 21,581 | 21,617 | -0.2 | -36 |
| Uxbridge | 21,556 | 21,176 | 1.8 | 380 |
| Brock | 12,567 | 11,642 | 7.9 | 925 |

Leave a comment