Tag: Map

  • Why transit system maps matter

    Why transit system maps matter

    I love maps, especially physical, paper maps. I like to visualize the places I travel to and determine how each city and region’s transit networks work. Though online interactive maps can be very helpful (like the ones I created to show all intercity transport services in Ontario and across Canada, filling a much-needed gap), there is still nothing like a well-designed static map, especially when it is in print and easily accessible to the public.

    This means providing maps that accurately and clearly depict the entire transit system, along with landmarks, connections, and frequency. Los Angeles Metro’s system map does a reasonable job for a map that covers a very large region.

    The Los Angeles Metro system map depicts the complex bus and rail network, including non-LA Metro agencies like Culver Citybus and Santa Monica’s Big Blue Bus. Colours and line width used to denote operator, service type, and frequency.

    Thankfully, most urban transit systems in North America continue to provide proper system maps both on their websites and in print, provided free on request at subway booths or terminal offices. (Some, however, have charged a small fee for a physical copy of their transit maps, such as San Francisco’s Muni.) In Europe, complete transit maps often have to be purchased, such as in Berlin or Vienna.

    I recently visited two mid-sized American cities that have done away with physical maps for their transit systems: Pittsburgh, Pennsylvania and Denver, Colorado. In those cities, figuring out how to get around by tram and bus was frustrating, even in an age of Google and Apple maps and transit planning apps accessible to anyone with a smartphone.

    Pittsburgh Regional Transit (formerly known as Port Authority Transit) operates a complicated web of bus routes that radiate from the city’s downtown core, along with a few cross-town and feeder routes. There are three busways and a light rail service to the southern suburbs. However, there is no proper system map, either in print or online as PDF or image file that allows the new or casual user to make sense of the network.

    Individual bus and LRT route schedules can be found under the Schedules tab on the PRT website, but one needs to know what route they are looking for. Under Rider Info, there is a link to a system map, but it takes the user to an ESRI interactive map.

    Screenshot of the system map page of the PRT website

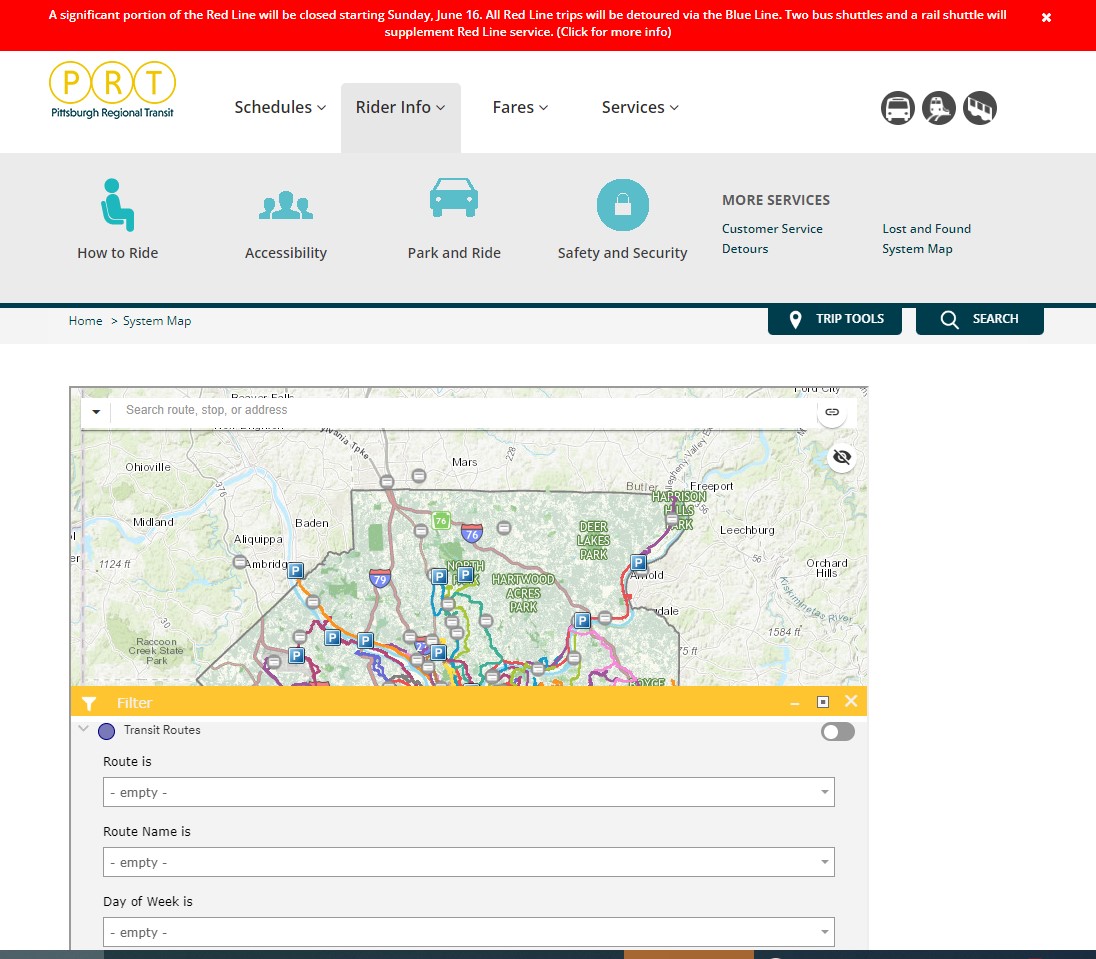
    The user can then select a service by route name or number in a drop-down tool, but the map itself is difficult to figure out. Zooming in reveals the location of fare vendors and park-and-ride lots, but not important service details like route numbers or service frequency.

    Zooming in, park-and-ride lots become the most prominent feature

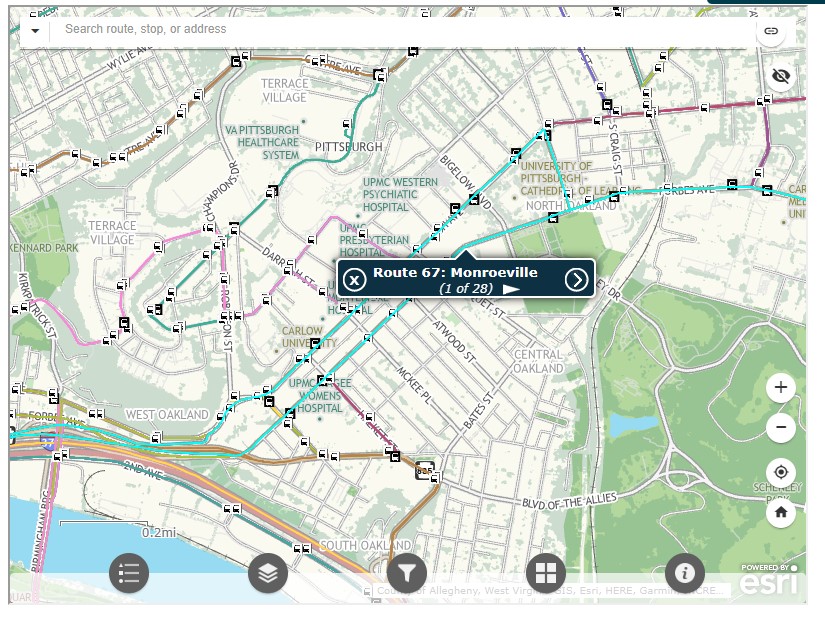
    Even at the neighbourhood level the map is difficult to read. The screenshot below shows Pittsburgh’s Oakland district, home to University of Pittsburgh, Carnegie Mellon University, several other educational institutions, medical centres, parks, museums, and cultural venues. Many bus routes follow Forbes Avenue and Fifth Avenue, but as each route is layered on top of each other, it is difficult to discern where each route runs and where they go.

    PRT’s ESRI interactive system map, zoomed into the Oakland District

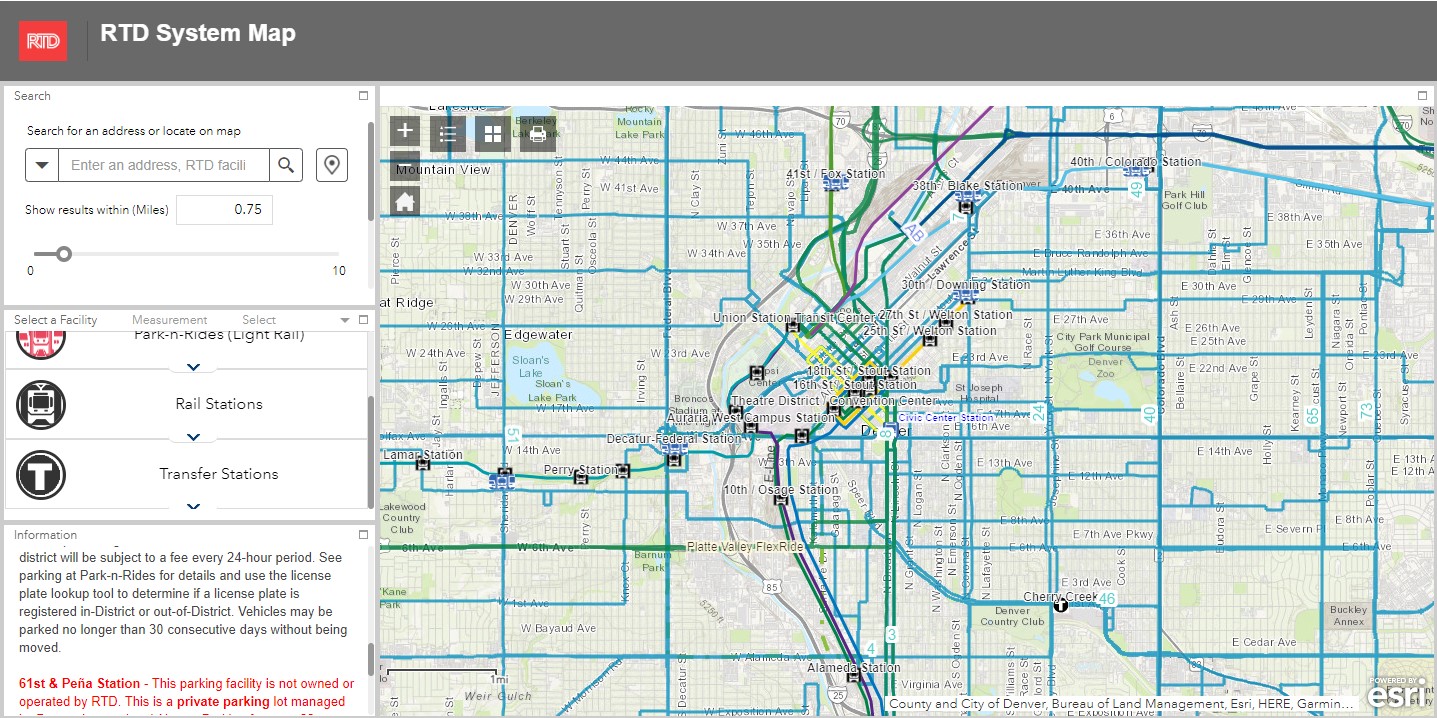
    Denver’s Regional Transportation District (RTD) also uses ESRI interactive maps to show bus routes (rail services are depicted in a static image map as well). At a small scale, only the light rail and commuter/regional rail services appear, along with transit park-and-ride locations. Denver’s bus system is less complicated than Pittsburgh, operating largely on a grid, but still, a proper map would make it much easier to get a sense of the network.

    RTD System Map zoomed out

    Zoom in, and bus routes appear, along with route numbers, but there is nothing to show the level of service for each route.

    Though online-only interactive maps have their purpose (my Ontario and Canada intercity maps are designed to show where connections exist, or not, and how to obtain schedule information), they are not well suited for urban transit systems and are very difficult to read on a mobile device. Properly designed static maps, in web image or PDF format do much better jobs.

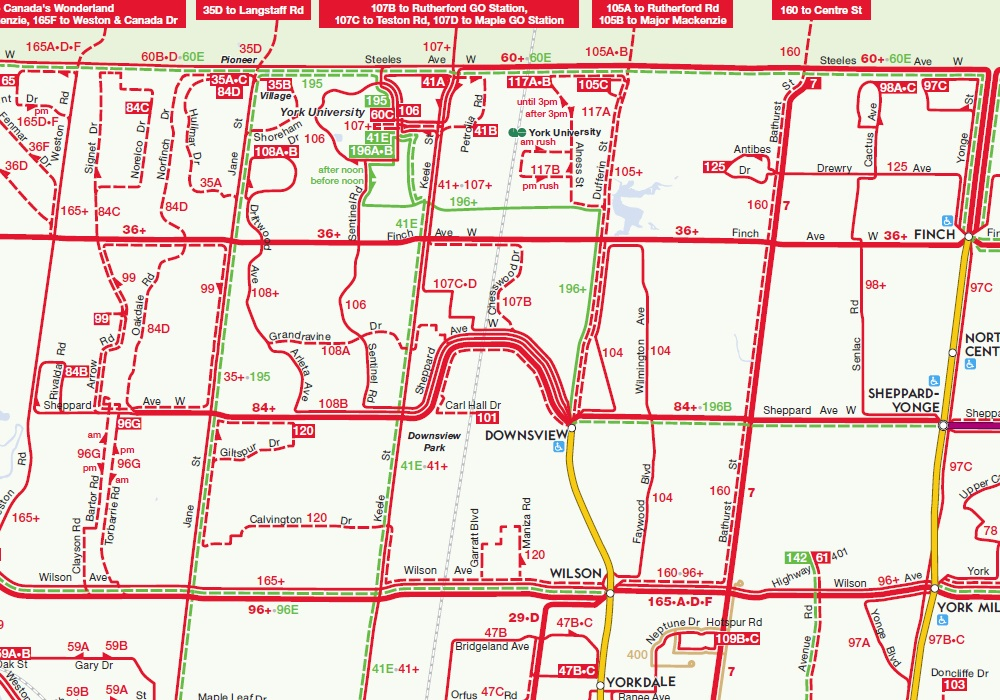
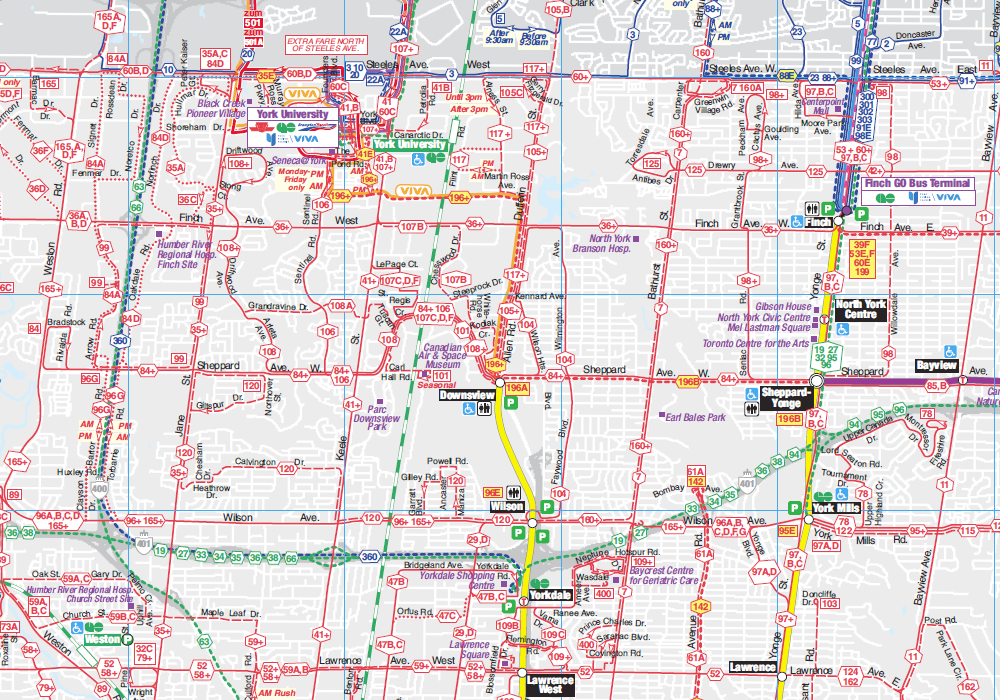
    It is worth comparing Pittsburgh and Denver to the Toronto Transportation Commission (TTC). The TTC’s complete system map is provided to customers for free at subway stations, with smaller, simplified versions available as tear-away pamphlets. Large-format versions are also displayed across the network in bus shelters and subway stations. A PDF version can also be easily found on the TTC website in the main Routes and Schedules page. Surface routes are categorized by service level (express, frequent service, regular service, limited service, seasonal, and community routes) with major landmarks and transfer points to connecting services clearly indicated.

    I have some minor complaints about the TTC’s map (like regular routes, express routes should be categorized in the map based on their service levels, for instance) but it is a reasonable, easy to read map that is also quite easy to find.

    Unfortunately, more transit systems are moving away from easily accessible paper maps. Durham Region Transit, for example, no longer provides copies of its system map. Fortunately, a proper, well-designed PDF copy remains accessible on its website.

    When travelling, or looking to understand a city’s transit network though, there is nothing quite like poring through a well-designed, easy-to-read paper map. It would be a shame if more agencies went the way of Denver and Pittsburgh.

  • Why Doug Ford’s plan for 25 Toronto wards is an attack on local democracy

    Ridings and 47 Wards.jpgMap of Doug Ford’s proposed 25 wards and the City Council-approved 47 ward boundaries

    Late last week, the newly elected Ontario Progressive Conservative government announced that they would be imposing a new electoral map on the City of Toronto, a decision that would eliminate the new 47 wards approved by Toronto City Council, replacing them with the same 25 boundaries used by the federal and provincial governments.

    It’s very clear that Premier Doug Ford’s plan, which requires a new piece of legislation, ironically titled the “Better Local Government Act,” is vindictive and mean-spirited because it only affects the City of Toronto, which rejected Doug Ford’s 2014 mayoral bid. It quashes the hopes of many young, racialized, and progressive candidates looking to change the make up of a council that has generally supported Mayor John Tory’s agenda. It is unfair to candidates that ran in good faith, started campaigns, raised funds, and spent money hiring staff, purchasing materials, and renting campaign offices.

    But most of all, Ford’s actions are an attack on local democracy because of the haste with which they are being made, at the end of the nomination period for those approved 47 wards. They ignore the years of study by independent experts and several rounds of public consultations. They also benefit Toronto’s suburban areas, which are growing at a far slower rate than downtown Toronto, North York Centre and Etobicoke’s waterfront area, which will be disproportionately affected by this arbitrary decision.

    Each new ward was designed to have an average population of 61,000, with a population range of between 51,800 and 72,000 (+/- 15%). They were designed to last for four election cycles, to be re-drawn before the 2034 election.

    It is worth noting that the independent experts looked at using the 25 federal/provincial boundaries twice. In the first study, they were rejected early on because they would not “meet the tests of effective representation.” The federal boundaries, which are also adopted by the province of Ontario, are based on population counts from the 2011 Census, and are already seven years out-of-date, while the consultants were tasked with developing new ward boundaries to last 16 years. Even a 50-ward solution (which mimics the old 44 wards based on the 22 federal ridings that were established in 1996 and came into effect with the 1997 federal election) would result in severe variations in population.

    Ridings and 2026 pop variation.jpgHow the 25 ridings, if used for Toronto’s ward boundaries, will vary in population by 2026

    After Tory’s Executive Committee tasked the Toronto Ward Boundary Review team to re-examine options that would see fewer than 47 councillors elected in 2018, they re-examined using the 25 ward boundaries. They found that in 2026, three of those wards — Toronto Centre, Etobicoke-Lakeshore, and Spadina-Fort York — would have populations over 30% higher than the ward average in 2026. Willowdale and University-Rosedale would also have had much larger populations than the city average.

    The review team also looked at a 26-ward option that mostly maintained the riding boundaries but added a new ward downtown out of the Toronto Centre and Spadina-Fort York constituencies and adjusted boundaries in southern Etobicoke. Even then, Etobicoke Centre and Etobicoke-Lakeshore would still have populations over 20% higher than the city-wide average. Despite making some adjustments for population growth, this option would have not have corresponded with some ridings, and was also not recommended.

    26 Wards and 2026 pop variation.jpgHow the modified 26 ridings, if used for Toronto’s ward boundaries, would have varied in population in 2026

    For those reasons, and to support local representation, the 47-ward solution was once again recommended, and was approved by City Council in November 2016. Councillors Justin Di Ciano (Ward 5) and Giorgio Mammoliti (Ward 7) then appealed the new boundaries to the Ontario Municipal Board, but they were dismissed. The 47-ward solution has survived despite it all.

    Mayor Tory may have brought back decorum to the mayor’s office after an embarrassing period under Doug Ford’s brother Rob, but he has pushed an austerity agenda, and has failed to show leadership on police reform, wasteful infrastructure spending, and safe streets for pedestrians and cyclists. His initial reaction, to call for a referendum on Ford’s plan to cut Toronto’s council, was a characteristically weak response; he was later pushed into supporting a legal challenge by an angry public. Meanwhile, some of Tory’s allies, like Di Ciano, David Shiner, and Glenn De Baeremaeker, support Ford’s actions.

    Ford’s attack on local democracy is an insult to candidates who have already put their names forward for election and launched their campaigns. It undermines the City of Toronto’s legislated responsibility to decide its own ward boundaries. And it will only exasperate existing disparities in council representation.

  • Mapping the 2018 candidates for Toronto’s 47 wards (Updated)

    18506683800_6c96dcc66b_k

    September 10, 2018
    This morning, the Ontario Superior Court ruled against Bill 5, finding that the bill  “substantially interfered with the municipal candidate’s freedom of expression that is guaranteed under [Section 2(b) of the Charter of Rights and Freedoms.]”

    Barring a successful provincial appeal (or invoking Section 33 of the Canadian Charter of Rights and Freedoms, also known as the Notwithstanding Clause), this is once again the map of council candidates for the October 22 election.

    September 12, 2018
    Oh, never mind. We’re back to the 25 wards because its not as if Doug Ford has anything better to do than override a judicial finding with the Notwithstanding Clause and re-introducing the vindictive legislation. And we may not even get to vote in advance polls.

    Once the new law is passed, there will be two days for council candidates to sign up to run in the 25 wards.


    August 15, 2018

    Bill 5, the so-called “Better Local Government Act,” passed third reading on August 13, 2018, and was given royal assent on Tuesday August 14, despite vigourous opposition from the New Democratic Party. Bill 5 passed without any public consultation that usually takes place with any government legislation, as the Progressive Conservatives used procedural tactics to push through the bill as quickly as possible.

    (A new map of the 25 wards can be found here.)

    This means that legally, the City of Toronto must follow the province’s edict and elect only twenty-five councillors, with wards based on the current provincial riding boundaries. Scarborough Councillor Glenn De Baremaeker has already announced that he will no longer seek re-election.

    I have no intentions of removing the map below, but I will be creating a new 25-ward map and populating it once nominations re-open. I suspect that many council candidates will not re-register, and that there will be many more incumbents facing off against each other.

    There’s a faint hope that a legal injunction could suspend Bill 5. Council candidate and lawyer Rocco Achampong is seeking one, the courts will hear arguments by the end of the month.

    (more…)

  • A new, improved TTC system map

    Last week, the Toronto Transit Commission quietly introduced a new system map on its website. The map, a 3.8 MB PDF file, can be directly accessed here.

    This new system map, which includes all scheduled routes including the limited-service community buses and the Blue Night network, is very different than previous editions of the TTC’s “Ride Guide,” but I think it is the best edition yet. That said, there are a few tweaks that I would like to see.

    Below is a screenshot of the new 2016 map, showing York University, Downsview Station, and North York Centre.

    TTCJan2016

    Unlike previous editions, the new Ride Guide is not to scale; subtle curves and bends in the road network are dispensed with in favour of a diagrammatic style, which shows transfer points very well. (It reminds me of the Los Angeles Metro system map.) Like the 2012 edition, shown below, only the streets served by surface routes are illustrated, but landmarks (such as hospitals, post-secondary education institutions, and major parks) are given more prominence than in previous maps. GO Transit rail lines are more prominent (with the same colours used on GO Transit maps and schedules), and there’s an effort to show connections with other transit systems, such as GO buses, and suburban agencies such as York Region Transit, Miway, and Brampton Transit.

    TTCAug2014
    Screenshot of the 2014-2015 edition of the TTC Ride Guide, showing the same area as the 2016 map.

    From 1994 to 2012, the TTC’s official system map included the routes of adjoining transit systems (see screenshot below). Note the YRT, GO Transit and Brampton Transit Züm routes converging on a very crowded York University. Depicting the connecting networks was certainly useful, but it added to a very cluttered map (which included the entire street network); it also relied on every other agency to provide timely updates. Removing the other transit agencies’ bus routes in 2014 allowed the TTC design team and cartographers to concentrate on their own system.

    In 2014, the system map was stripped of almost all features apart from the TTC’s own routes, a decision I criticized in a previous post. All landmarks were removed, as were all connections, apart from faint lines showing GO Transit rail corridors. It was easier to read, but went too far in removing important and use information. But it had a few improvements, such as highlighting the “frequent service network” – surface routes that operated every ten minutes or better at most times of the day. Express bus routes were better depicted.

    The 2016 edition restores these features lost in 2014. In a few places, the logos of the suburban transit agencies are once again shown, such as York University (where Brampton Transit, GO Transit and York Region Transit connect) and Pearson Airport (where Brampton, Miway and GO also operate). The contact information for the five neighboring systems is also included on the map. The addition of the frequent service category remains.

    TTCNov2012November 2012 Ride Guide

    Overall, I think the new map looks great. Surface routes are clearer, GO Transit rail lines are more prominent, and more points of interest are shown. Not only does downtown Toronto get a new inset, so does a complex section in north Scarborough, where the 102 Markham Road, the 53 Steeles East, and the 42A Cummer routes converge. The TTC design team has done a fine job.

    But I did find a few things about the new 2016 edition that I would like to see improved:

    • Hospitals are labelled inconsistently. Humber River, Sunnybrook, and Scarborough Centenary are, but North York General, Etobicoke General, Scarborough General, St. Joseph’s, East Toronto General, and the downtown hospitals are not.
    • Some suburban connections are shown, most are not. Pearson Airport shows GO, Brampton, and Miway logos, and York U shows GO, Zum, and YRT logos, but they are missing from Humber College, a major terminal for Brampton Transit (511, 11, 50) and Miway (22, 107), it’s a terminus for a YRT route as well. Rouge Hill GO shows a DRT logo, even though this is a very limited service, but there isn’t one for Miway at Long Branch, where two major routes, 5 and 23, terminate.
    • I’m not sure I like how branches are labeled now; I miss the use of the “+” that denoted a section of a route on which all branches operated on.

    Hopefully, we will see these relatively minor issues corrected in the next edition of the Ride Guide, which will likely be issued later in 2016.


    If you’re interested in the history of TTC maps, Transit Toronto has a fine archive of old system and subway maps dating back to the 1930s. It’s worth a look.