Tag: Maps

  • Mapping Mayor Tory’s support on Council

    Matt Elliott, columnist for Metro Toronto, is one of Toronto’s greatest observers of local politics. One great service that he does is keep track of all important votes at Toronto City Hall. Originally, this work tracked each councillors’ support for Mayor Rob Ford from 2010 through 2014; now his scorecard tracks how each councillor voted according to Mayor John Tory’s agenda. The Council Scorecard spreadsheet is available here.

    In 2014, I created several maps using Elliott’s data that helped to show how Rob Ford lost control of City Council. In Ford’s first year, he was able to count on the support of 22 councillors, enough to get most of his agenda passed. But by 2014, only two councillors – Giorgio Mammoliti (Ward 7) and Rob’s brother, Doug (Ward 2) voted with the mayor at least 70 percent of the time.

    I felt it was about time to map how well Mayor Tory is doing.

    torys-team-score-2015
    Team Tory Score, as of December 2015

    In his first year as mayor, from December 2014 to December 2015, Tory enjoyed the support of over half of Toronto City Council; 24 of 44 councillors voted with the mayor at least 70 percent of the time. Important votes on budget austerity, council appointments (such as Police Board Chair and Tory friend, Andy Pringle), approving the “Hybrid” option for the Gardiner Expressway, and approving Uber’s operations in Toronto were all passed.

    But there were some surprises. Many key Tory supporters voted against the mayor on a motion introduced by Councillor Justin Di Ciano (Ward 5) to ask the province not to support ranked ballots. The mayor, who supported the electoral reform, lost that vote.

    In that first year, most other councillors provided some support, voting with the mayor at least 30 percent of the time, including former mayor Rob Ford (Ward 2). The wards that these councillors represent are marked in orange. Generally, these wards are represented by centrist or left-leaning councillors such as Josh Matlow (Ward 22), Maria Augimeri (Ward 9) and Shelley Carroll (Ward 33).

    Only two councillors — Mike Layton (Ward 19) and Joe Cressy (Ward 20) voted opposite to Mayor Tory over 70 percent of the time in 2015.

    torys-team-score-to-june-2016
    Team Tory Score, as of July 2016. Votes from the October 2016 Council Meeting not yet included. 

    So far in 2016, the divide between the allies of the mayor and his opposition widened. Only ten councillors were left in the middle (all centre-left), while five councillors — Gord Perks (Ward 14), Kristyn Wong-Tam (Ward 27), Paula Fletcher (Ward 30), Janet Davis (Ward 31), and Anthony Perruzza (Ward 8) joining the opposition. With the exception of Ward 2, vacated after Rob Ford’s death, all councillors from Etobicoke and Scarborough became clear Tory allies.

    It’s worth noting few normally centrist councillors, who were very effective in opposing Rob Ford’s agenda last term, are now staunch allies, including Paul Ainslie (Ward 43), and Bailão (Ward 18). Both are members of Tory’s Executive Committee; Ainslie, a centre-right councillor who has earned my great respect, was also appointed chair of the Government Management Committee.

    Opposition to Tory’s agenda from councillors in the Toronto-East York region might help to explain why the Executive Committee, hand-picked by Tory and his transition team, did not have much enthusiasm for the 47-ward solution recommended by consultants on the Toronto Ward Boundary Review team. To reflect population growth, Downtown Toronto would get three new councillors in 2018, as would central North York. One ward would disappear in Toronto’s west end; incumbent councillors Ana Bailão (Ward 18) and Cesar Palacio (Ward 17), both Tory allies, are the most affected by that change. In May, the committee requested that the consultants go back to the drawing board and look at a new 44-ward option, as well as ward boundary options consistent with provincial and federal ridings. The consultants did that, and are once again recommending the 47-ward option.

    Almost half-way through his term, Mayor Tory has a confident and strong hold on Council, which has so far supported an agenda of austerity, along with major (and in my view, unwise) transportation infrastructure projects like the Scarborough Subway and the Gardiner East reconstruction.

    It is worth noting as well that apart from Bailão, all councillors from “downtown” wards were frozen out of Tory’s inner circle, even though many downtown and midtown wards enthusiastically voted for Tory in the 2014 election. Furthermore, most of the same councillors that support Tory at least 70 percent of the time also supported Ford’s agenda in 2011 and 2012. Key supporters of Ford’s early agenda went on to sit on John Tory’s Executive Committee.

    While there’s a slightly conservative bent to Toronto City Council, left-leaning mayor David Miller was able to work with centrists and conservatives, including suburban councillors, to implement his agenda, appointing several to key boards and committees. Tory, on the other hand, has frozen out council’s progressives, perpetuating an urban-suburban divide.

    ford-nation-percentage-2011-crop
    Mayor Rob Ford’s allies and foes in 2011

    It’s possible that Tory’s hold on power will slip as councillors get restless, or if there’s a backlash to cuts to city services such as the TTC or the Toronto Public Library. After all, Rob Ford’s hold on power slipped long before the crack scandal as residents fought back against budget cuts, and council quashed the Ford Brothers’ attempt to build a Ferris wheel and mall in the Portlands.

    The mid point between municipal elections is coming up, and there’s an opportunity to make changes to committee and board appointments. There’s still an opportunity for new alliances to be made and for goals to change to support a growing city and address growing economic disparity.

  • Mapping Toronto’s homeless shelters: an interactive mapping exercise

    Earlier this week,  I mapped the locations of Toronto’s homeless shelters for Torontoist. While there are shelters located across the city, the capacity is located almost entirely within the old city of Toronto, especially in the Downtown east side, between Church Street and the Don River. This is despite the fact that the need for shelters, like all social services and affordable housing, is city wide. I obtained the homeless shelter data from the City of Toronto’s Open Data catalog.

    https://seanmarshall1.cartodb.com/viz/418097ea-71f9-11e5-8d00-0e787de82d45/embed_map

    Unlike previous mapping exercises, I used CartoDB to create an interactive map, rather than relying on Quantum GIS (open source GIS software) or ESRI ArcGIS (software developed and maintained by the leading GIS firm) to create static maps. Importing data into CartoDB is quite easy; the selection of simple base maps is also very helpful. Creating legends and classifications had a bit of a learning curve, but on the whole, I was quite pleased with the result.

  • Mapping the City’s Bike Network Gaps

    Bike-Routes-WO-GapsToronto’s Bikeway Network, as of January, 2015

    Over at Torontoist, I posted a short article about the gaps in Toronto’s cycling infrastructure. You can read it here. What follows is a quick summary and some more thoughts (and another map, showing the bikeway network without the sharrows and signed routes without bike infrastructure).

    Toronto’s bikeway network is composed of multi-use paths (off road trails in parks and ravines, shared with pedestrians), cycle tracks (separated bike lanes like those on Sherbourne), bike lanes and contra-flow bike lanes (painted bike lanes without separation; I don’t consider the flex-posts on Adelaide, Richmond and Wellesley to be proper separations — see this Metro Toronto article about a garbage truck entering the bike lane and destroying these flimsy plastic markers). The city also considers other signed bike routes (usually quiet residential and collector streets without heavy traffic) and sharrows to be part of its bikeway network, but I don’t.

    Bike Routes - WO Gaps, sharrowsToronto’s Bikeway Network, as of January, 2015, with the sharrows and signed routes removed
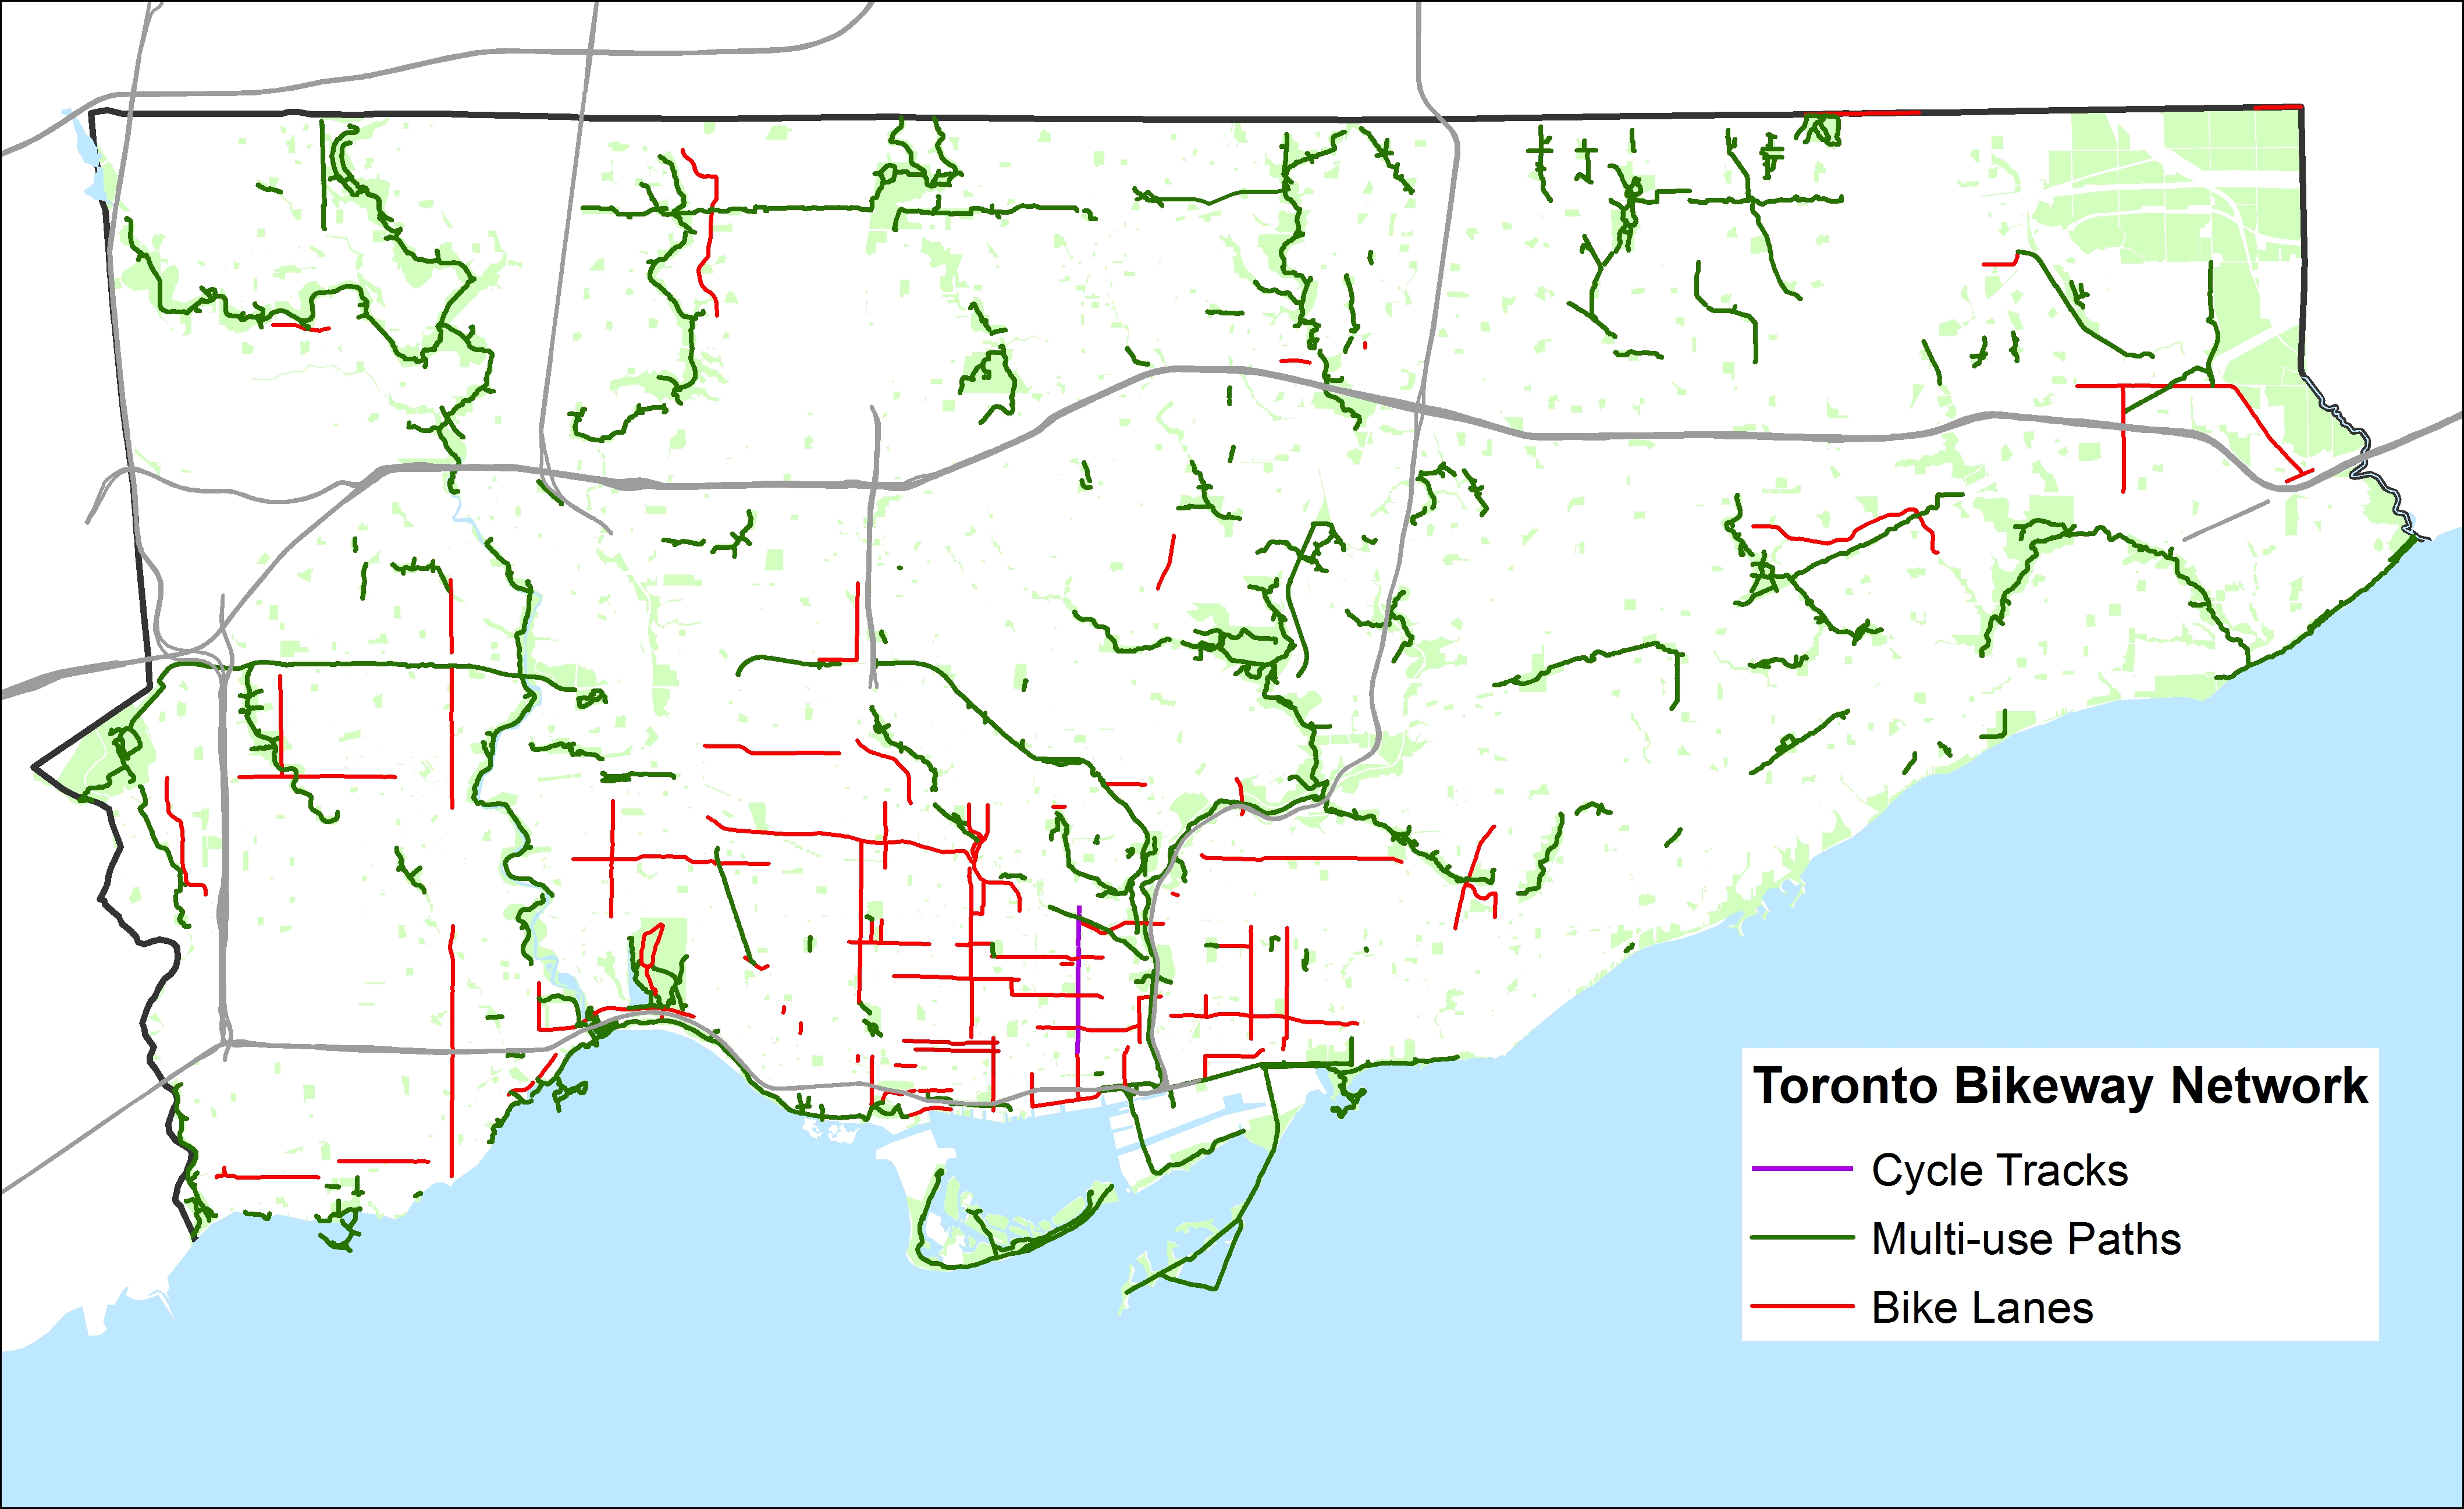
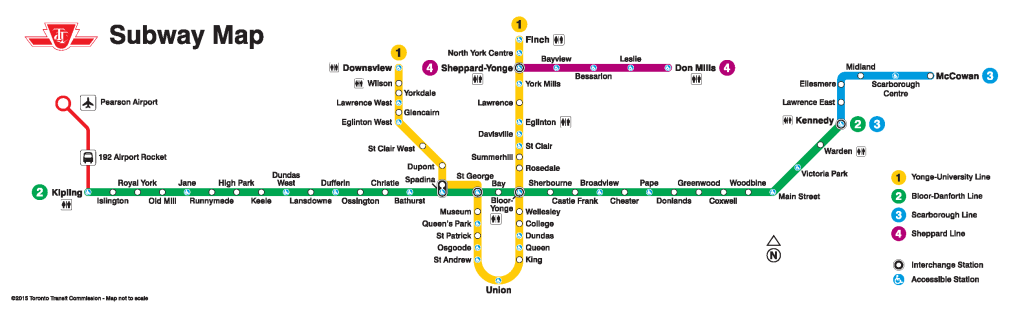
    When the sharrows and signed routes are eliminated, Toronto’s bikeway network looks very thin, especially outside the downtown core. Furthermore, most multi-use trails (shown in green) are not cleared in the winter (the Martin Goodman Trail the only exception) and many are unlit; they are not the safest options for women or vulnerable users.

    Below, I show some of the gaps in the existing network; where bike lanes and multi-use trails should be connected to create at least a complete network of bike-friendly routes across the city. Several circle routes are slowly coming together (via the Humber, Don, Rouge, Highland Creek and east-west hydro corridors) but there are many gaps that need to be closed to complete these circuits. The Waterfront trail is a disconnected labyrinth in Scarborough; I’d like to see a new multi-use trail beneath the beautiful Scarborough Bluffs to connect the trail to the parks below otherwise isolated and inaccessible without a car.

    The gaps in the existing bikeway network show the shortcomings in cycling infrastructure to support a minimum grid of safe bike routes in the suburbs, which would be mostly built on city streets, not in ravines or hydro corridors. Note that there are only three designated places to cross Highway 401, which is a much greater barrier to more Torontonians than the Gardiner Expressway is downtown.

    For his part, during the 2014 campaign John Tory said that he would support bike lanes where it was “sensible.” But he did not define what that meant or provide a timeline for specific goals. Given the number of bike-unfriendly councillors returned to city hall; one of whom is now John Tory’s deputy mayor, I don’t have too much confidence in seeing much more than a few downtown projects and more multi-use trails constructed in the next four years.

    Bike-Routes-Gaps
    Some of the many gaps in the existing bikeway network

  • The over-simplification of the TTC’s maps

    IMG_7647[1] The 192 Airport Rocket on the new TTC subway map posted in its trains

    The Toronto Transit Commission (TTC) introduced a new subway map on “T-1” subway trains, the older 6-car trains used on the Sheppard Line (known as Line 4), and the Bloor-Danforth Line, now known as Line 2. I first spotted the new map a few days ago and I have a few thoughts about it.

    In the latest edition of the map, found over every second set of doors, a red line representing the 192 Airport Rocket bus route was added, the first time a bus route was included on a TTC subway map. It’s a helpful reminder to passengers that a fast, frequent, affordable, and usually reliable airport transit link exists. I could quibble about the details (which makes little sense; I’d simply terminate the line at the airport icon), but it’s a great addition to the map. Now that the premium Union-Pearson Express train is about to launch, it’s an excellent time to remind customers about the TTC’s affordable airport link. (It’s worth noting that the MTA in New York City includes bus routes to LaGuardia and JFK airports on its subway maps as well.)

    Another little change that I like is the removal of the word “Spadina” from the name of the Yonge-University-Spadina Line, now known as Line 1. With the subway extension to Vaughan [ugh] Metropolitan Centre due to open in 2016 (though it may end up being 2017), Line 1 will now serve all four of Toronto’s universities (not counting secondary campuses): Ryerson, OCAD University, the University of Toronto, and York University. Since the line only operates under Spadina Road for less than 2 kilometres, and will extend beyond the old Spadina Expressway alignment (now Allen Road), the shortened name makes a lot of sense.

    And there’s one more great little addition to the new map: information on how to purchase your own subway map via the TTC’s website. The TTC’s slowly starting to realize the demand for transit-related merchandise; it recently began selling re-prints of old promotional posters and maps to the public via a new Shop TTC page on its website and through the new Spacing Store. An authentic subway map can be yours for $10. The new maps also emphasize the subway lines’ numbers over their names, part of a larger TTC wayfinding strategy. Numbered bullets, similar to those used in New York City, are used on new signage and maps for each subway and RT route.

    IMG_7644[1] Spadina is dropped; information on how to buy your own map

    Despite these changes, I feel the new map edition is still two steps forward, two steps back. For one thing, there are too many details removed. Compare it to the 2005 subway map [PDF, archived at Transit Toronto]. The 2005 map includes the station’s address (which is quite useful on Yonge, Bloor, and Danforth if looking for the closest station to a specific address), whether a paper transfer is required to connect with surface transit routes, and the locations of commuter parking lots. On the 2005 map, the international symbol of access (the blue wheelchair icon) indicates which stations in the system are fully accessible. In 2005, 22 1/2 of 69 subway and RT stations were accessible. (The 1/2 refers to Spadina Station, where the University-Spadina Line platforms are not accessible to persons using wheeled mobility devices, but the platforms for the Bloor-Danforth Subway Line 2, buses, and now, streetcars, are.)

    Ten years later, in 2015, 11 additional stations were fitted with elevators, bringing the total up to 33 1/2, nearly half of the TTC’s 69 stations. The 2015 map still includes the ISA icons, but they are now smaller, located within the white dots indicating the location of each station. In the photo below (taken with an iPhone), Scarborough Centre, Kennedy, Victoria Park, and Main Street, all accessible stations, are nearly indistinguishable from other, nearby stations that are not. The ISA icons are practically illegible from any distance or to anyone with impaired vision. This is the greatest failure of the new subway map; I believe that the TTC should re-issue these subway route maps for this reason alone.

    IMG_7645[1]

    The new subway maps available on the internet and on the Ride Guide paper system map have white backgrounds (perhaps to save printer toner if one wishes to print the PDF?), but it the same flaws as the version used in the subway trains.

    Subway_Map_2015
    Click image for full-resolution version on the TTC’s website

    The new, over-simplified subway route map reminds me of complaints that I had about the new TTC system map, released in mid-2014. The old system map was too large and cluttered (see the 2013 version archived at Transit-Toronto [PDF]) and was in need of a re-fresh. In the new map, the street grid is removed; as are bus routes operated by adjoining systems, such as GO Transit, Miway and York Region Transit. Landmarks are removed as well, but the addition of thick lines representing frequent-service surface routes was a nice addition. Green lines indicating express bus routes was also a great feature, though I don’t understand why frequent express routes, like the 196 York University Rocket, weren’t represented by thick lines either.

    Hopefully the TTC will re-think and revise both maps in the very new feature.