Tag: transportation

  • One more sign should do it…

    A gigantic school zone speed limit sign on McCowan Road in Scarborough

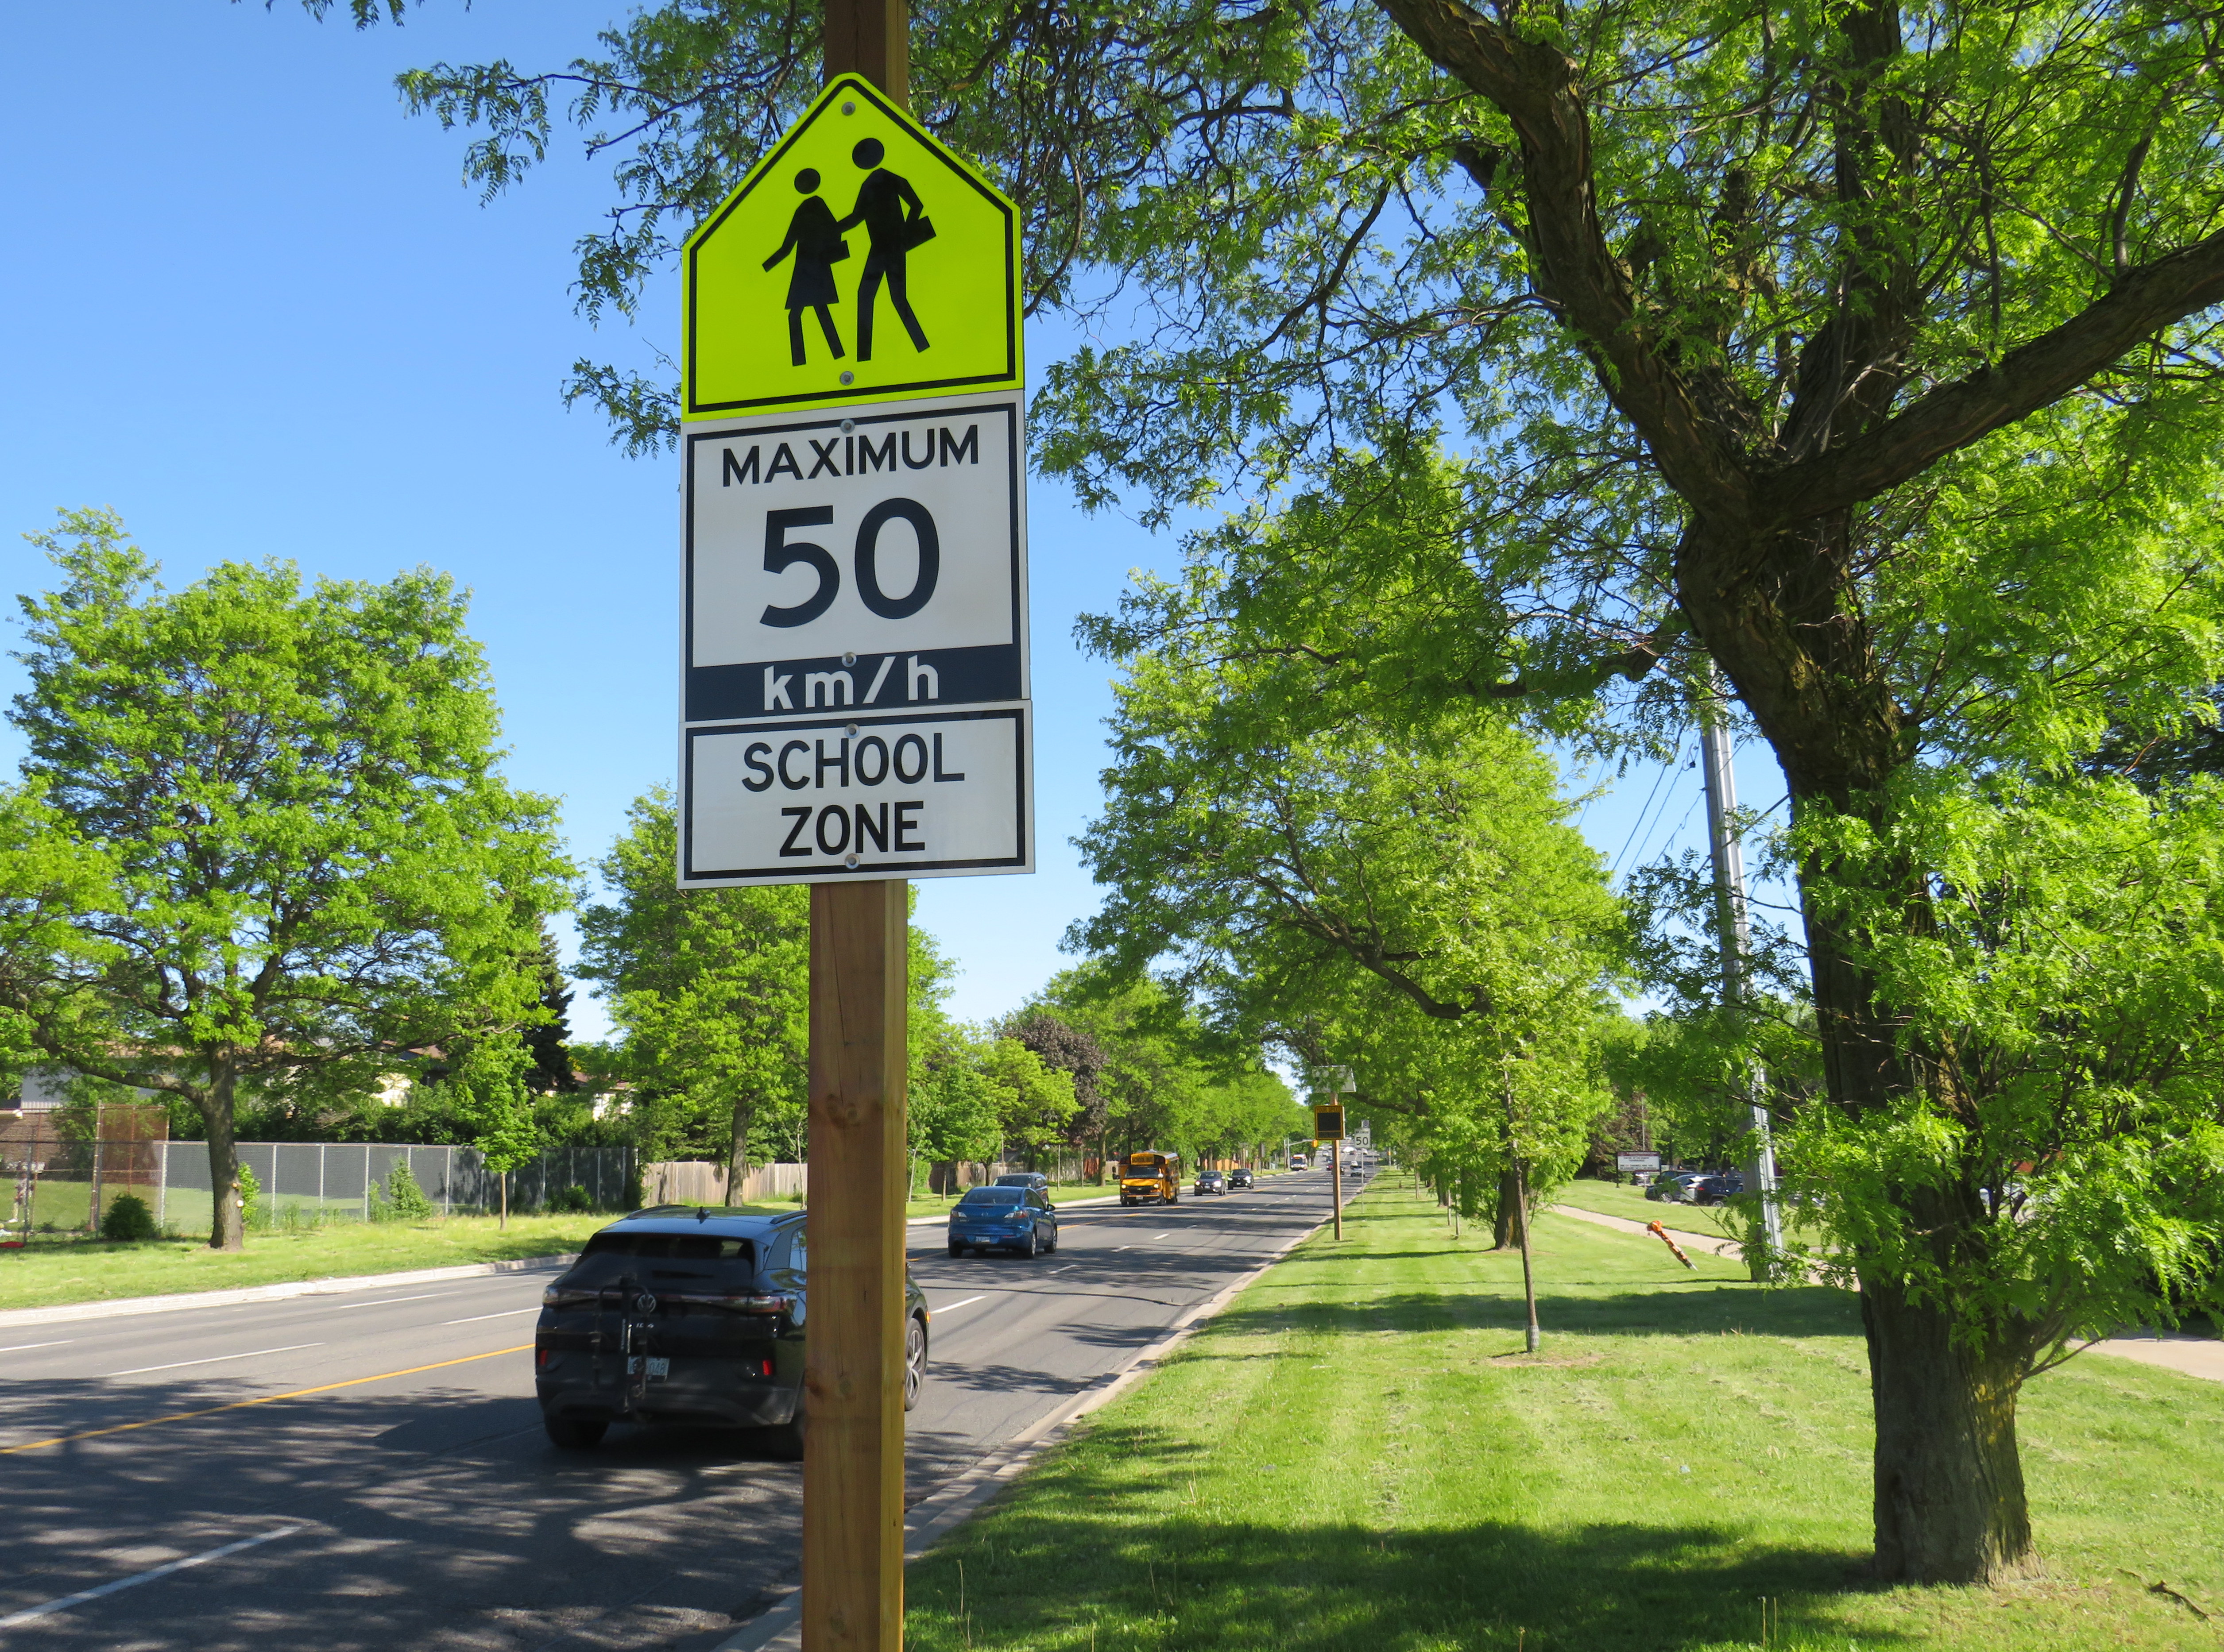
    Months after Doug Ford’s provincial government banned the use of municipal speed enforcement cameras, calling it a “cash grab,” new supersized school speed zone signs are going up across the province. The first ones I encountered are on McCowan Road in Scarborough, near my spouse’s family home.

    The signs, placed near St. Ignatius of Loyola Catholic School south of Finch Avenue, are gigantic: nearly 2.5 metres tall, mounted over three metres above the ground, affixed to an extra large wooden pole as the new signs were too big for the standard metal poles used for that purpose. The province delivered 80 signs to the City of Toronto, but with four signs per school zone (two mounted in each direction including advance warning signs), that meant only 20 schools would get these new totems.

    The new supersized school zone sign next to an older “community safety zone” sign, affixed to a standard metal sign pole

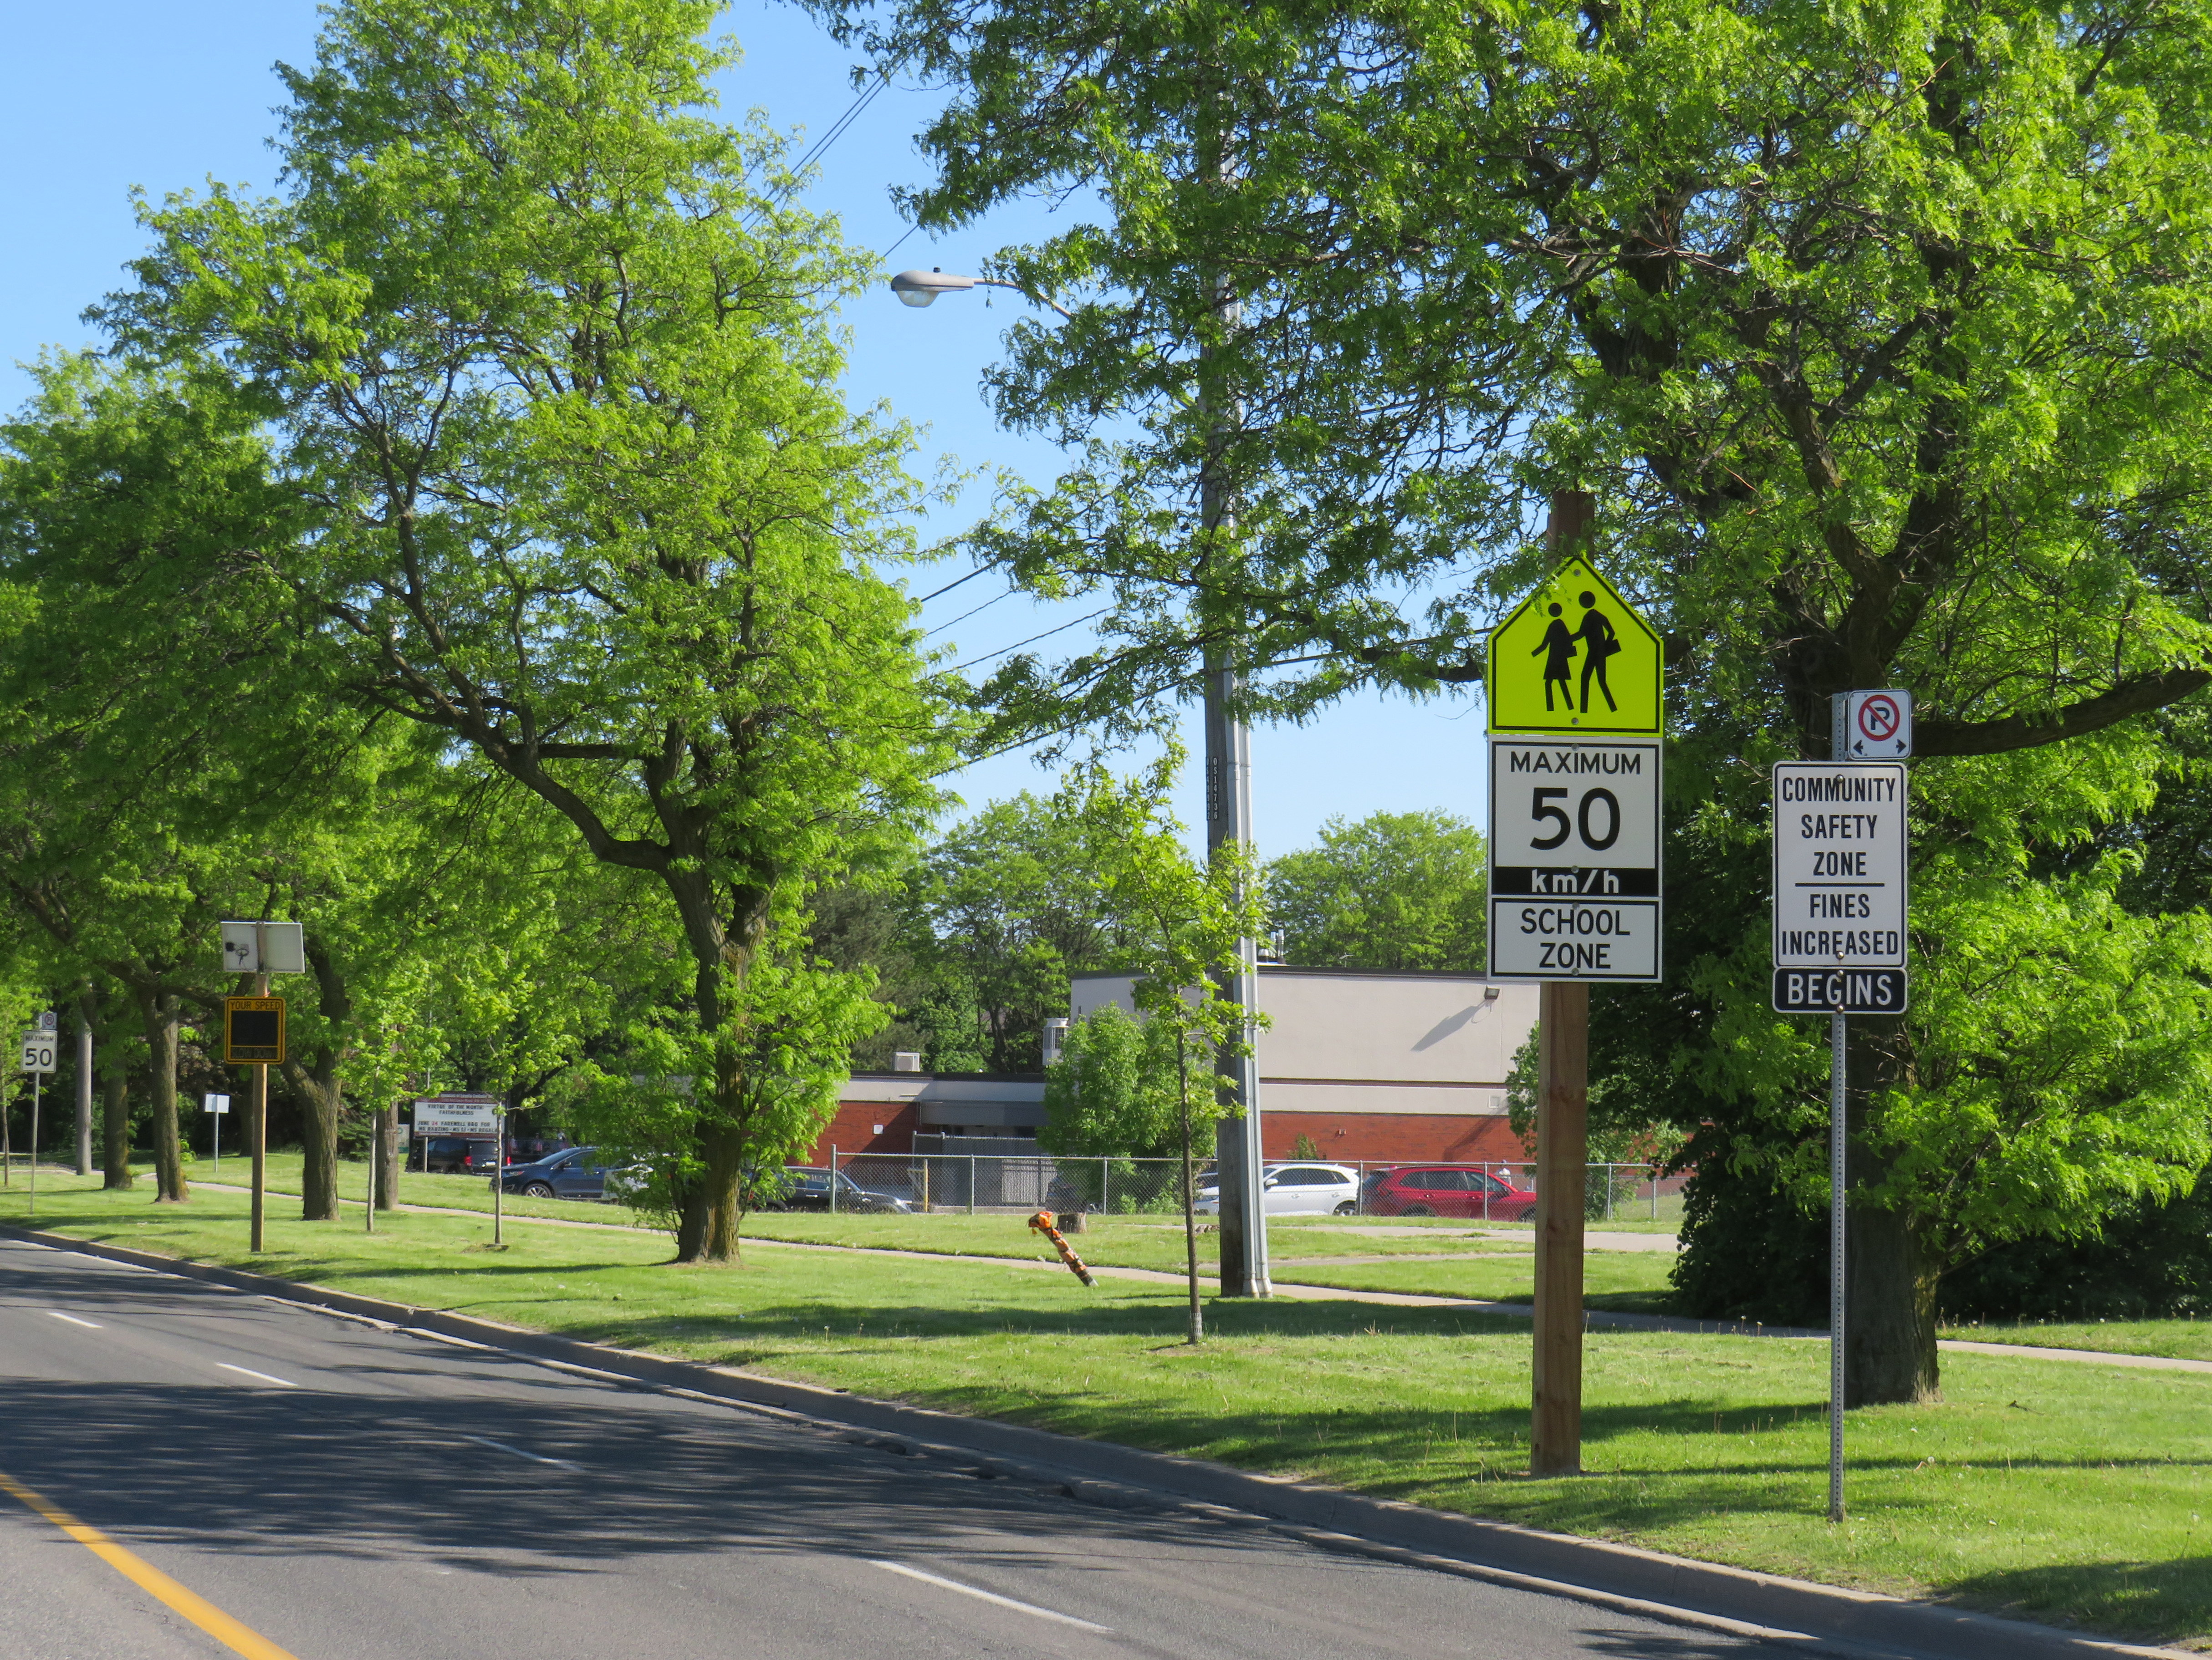
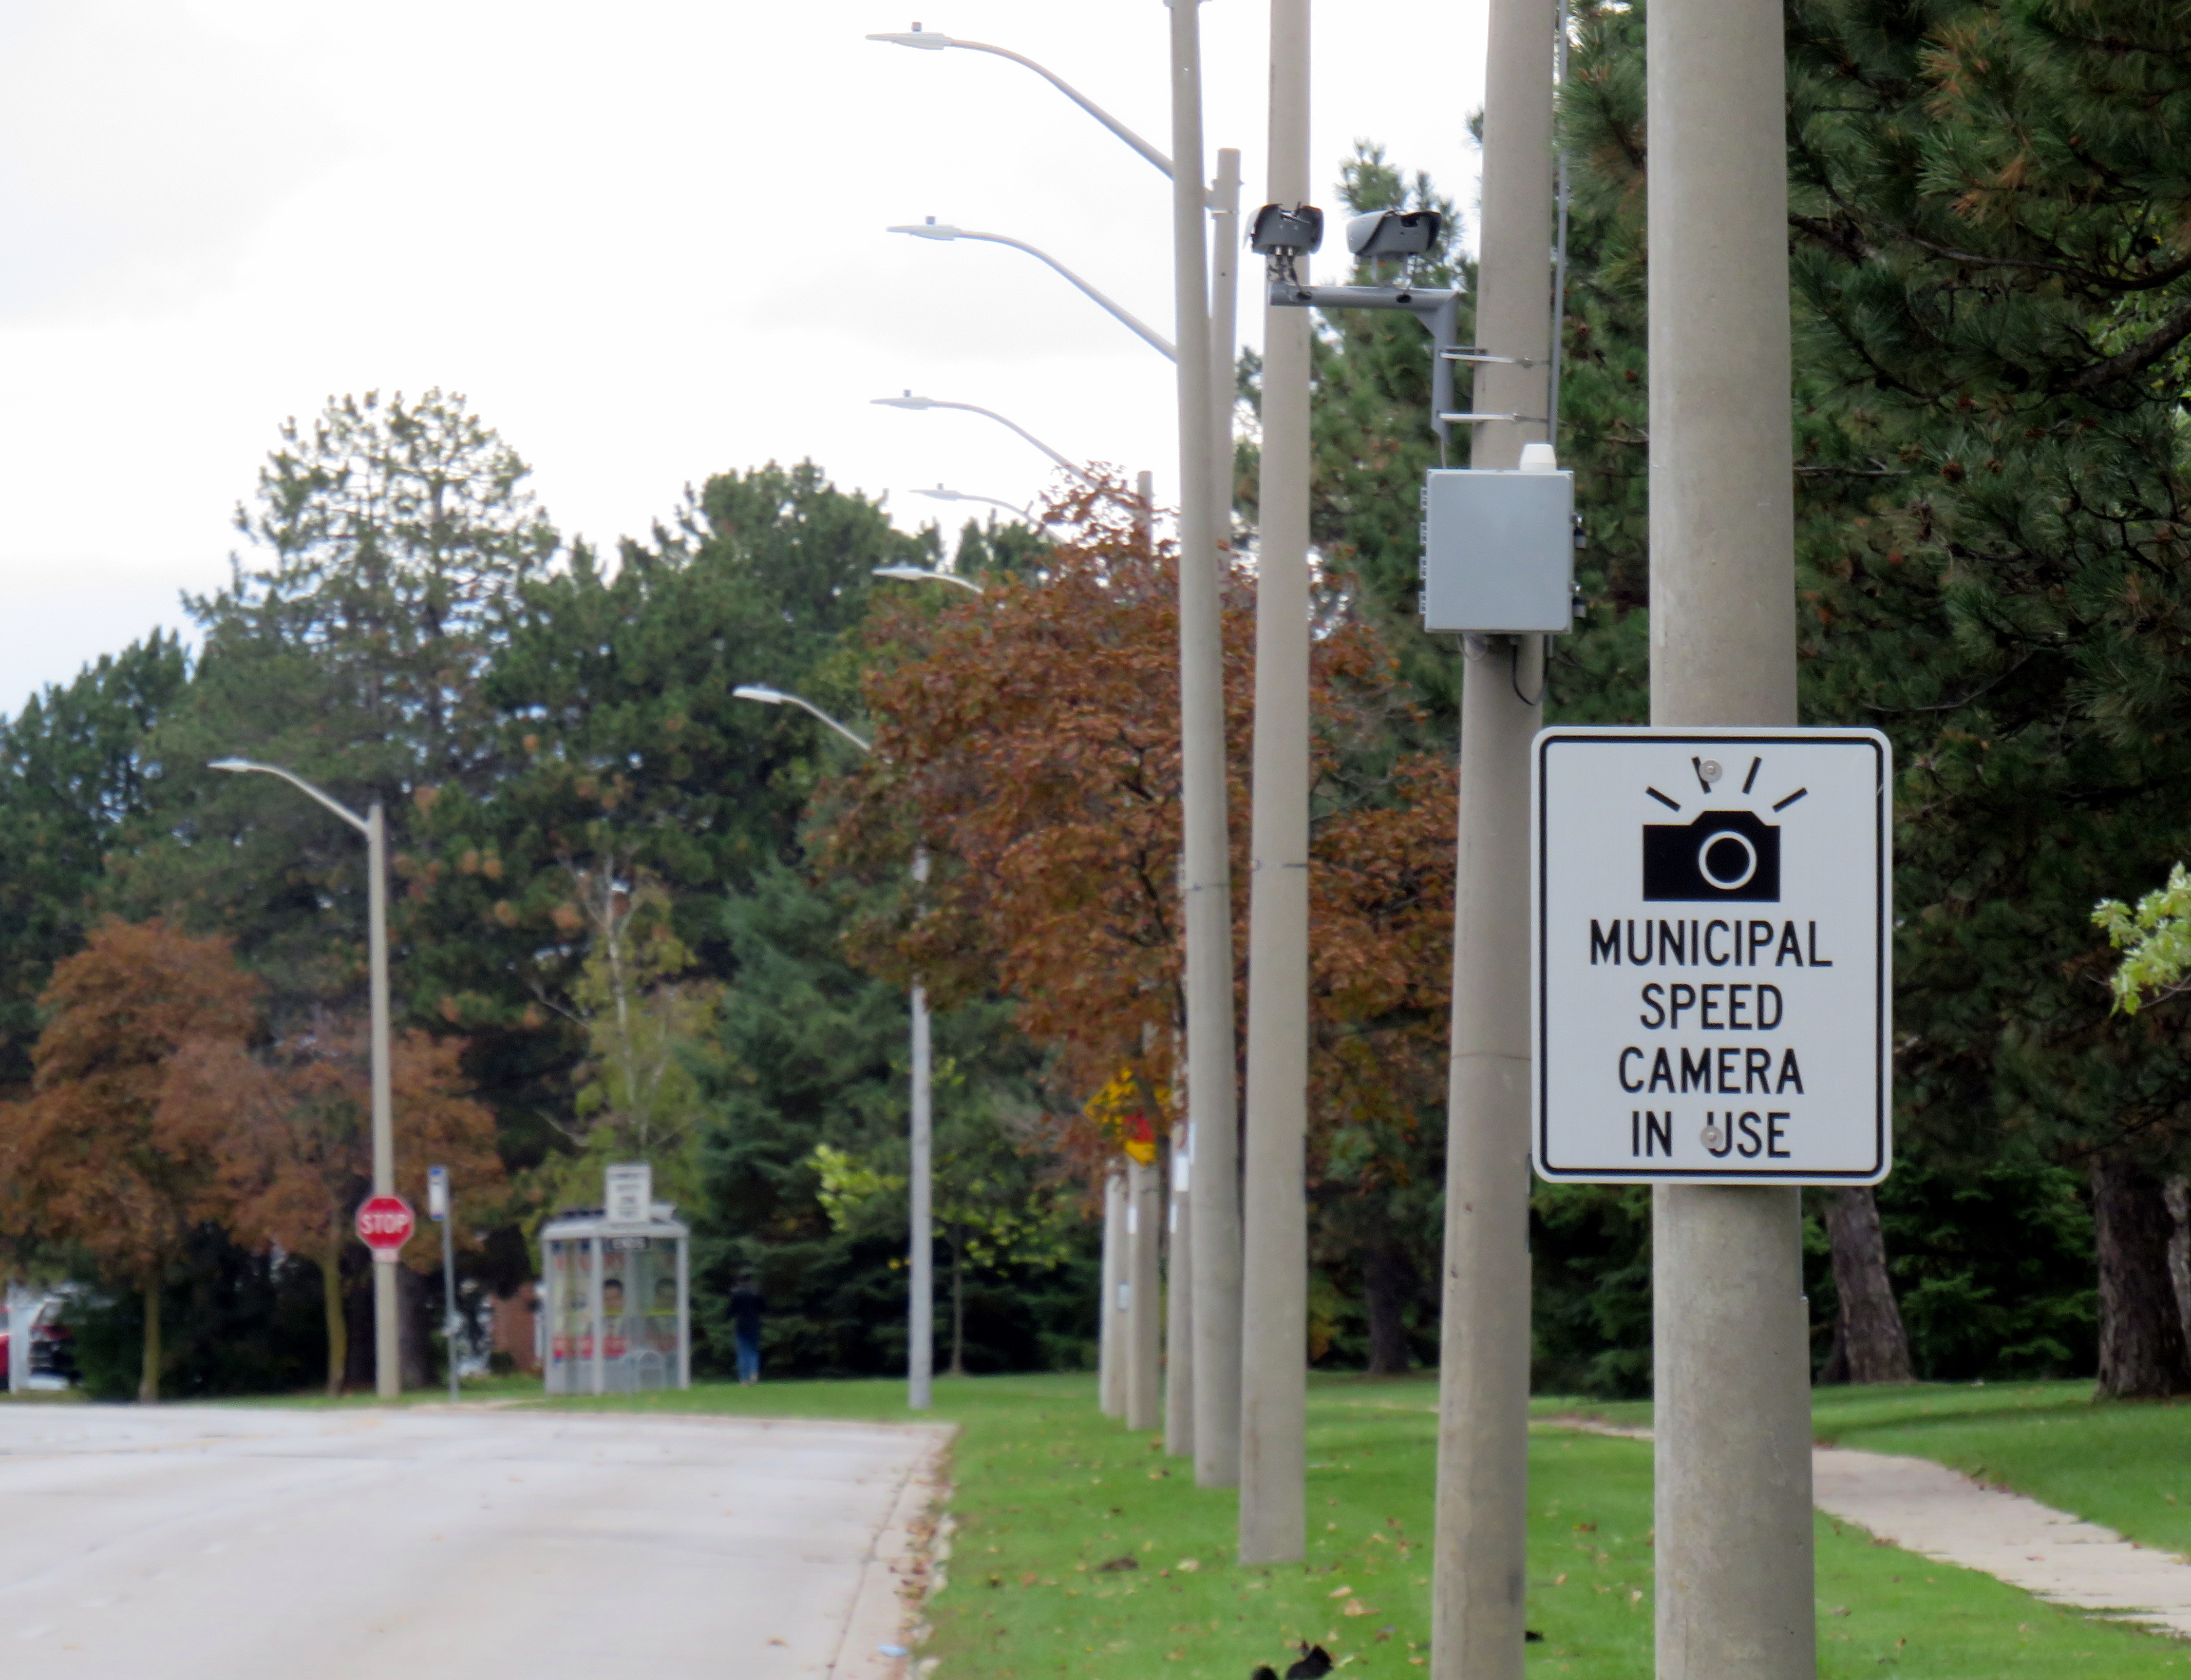
    Before the pro-driver legislation was enacted on November 14, 2025, there was a speed camera placed on McCowan Road adjacent to the elementary school, one of 150 located in the City of Toronto. Under provincial law, municipal speed cameras were only allowed to be installed in specific designated safety zones, namely roadways adjacent to schools, parks, or seniors’ residences, and had to be accompanied with advisory signage.

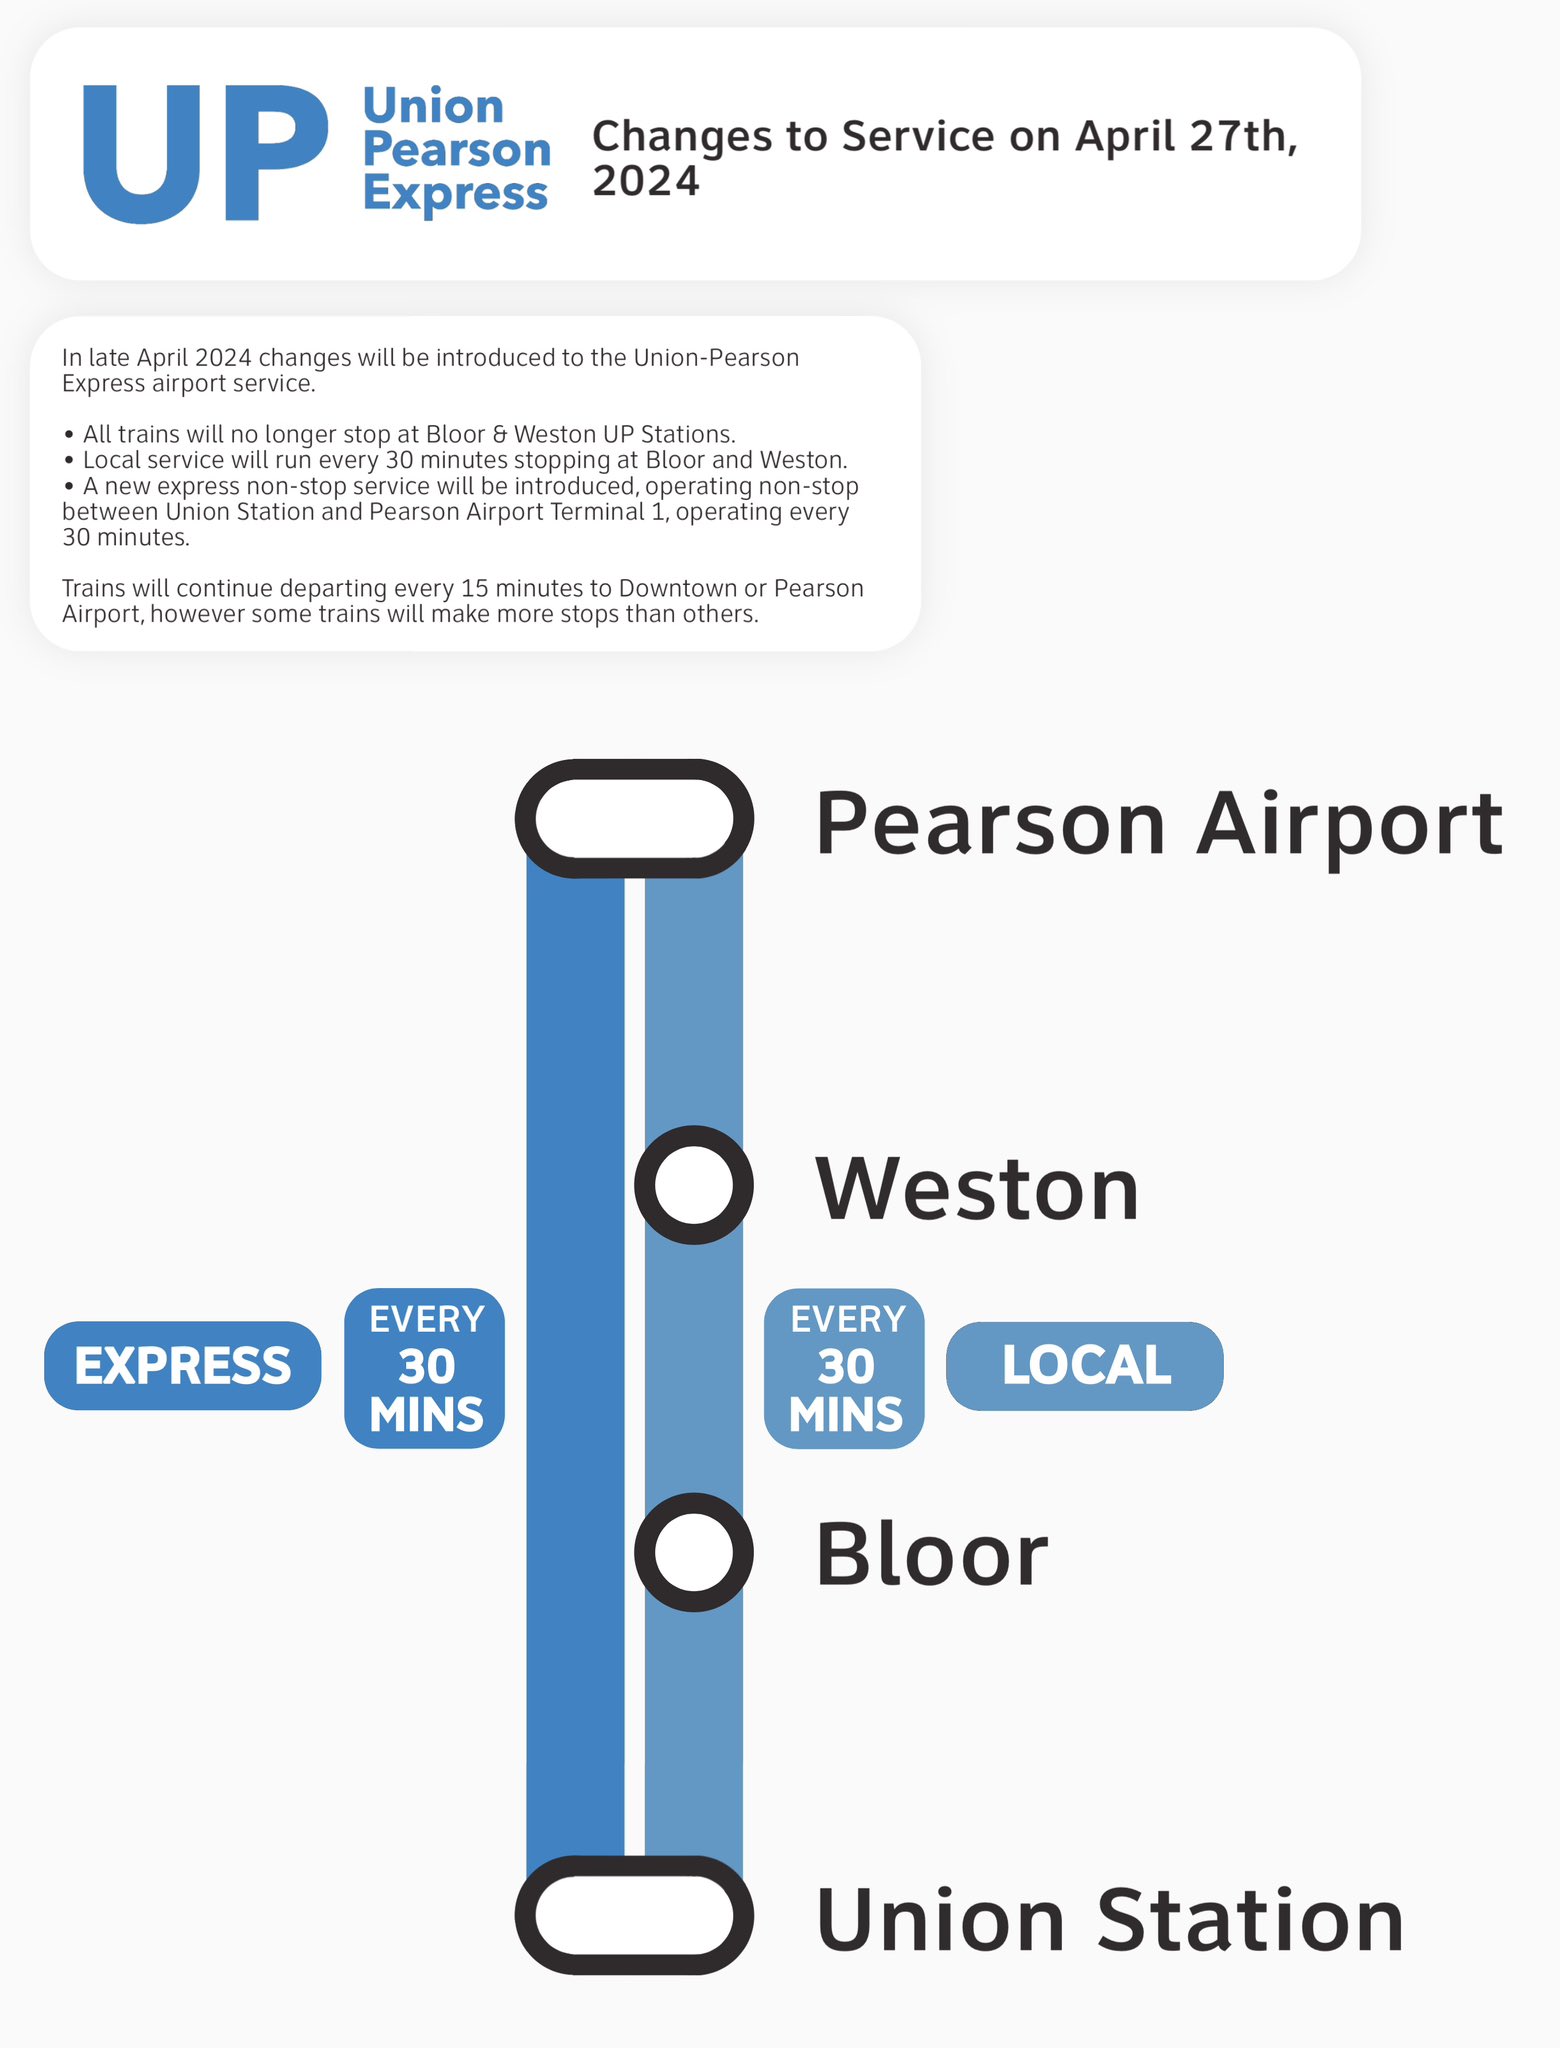
    Between April 2024, when the camera was activated, and July 2025, when the camera was destroyed (one of many vandalized that year), over 19,000 speeding motorists were captured by the photo camera travelling at least 11 km/h over the posted speed limit. This was despite the existing maximum speed, school zone, community safety zone, and municipal speed camera signs on this stretch of road.

    Sign warning of a municipal speed camera in Brampton in October 2025

    Despite the high number of infractions, the cameras were doing their job; a job that the Toronto Police isn’t motivated — or able — to do. As seasoned municipal watcher Matt Elliot points out, for period between January 1, 2025 through November 14, 2025 (when camera enforcement was forced to end), 628,165 speeding tickets were issued through the automated speed enforcement program. Toronto Police’s “Vision Zero” traffic unit issued just 14,500 tickets.

    New city report notes the Toronto Police Vision Zero Enforcement Team handed out about 14,500 speeding tickets in 2025. Might sound like a lot, but well, compare and contrast.

    Matt Elliott (@graphicmatt.com) 2026-06-03T14:46:06.746Z
    Post by City Hall Watcher Matt Elliot

    Despite all those tickets issued, the cameras were especially effective at reducing speeding in school zones. A 2025 Toronto Metropolitan University/SickKids Hospital study found that speed enforcement cameras reduced speeding by 45 per cent and reduced speeds by most drivers by more than 10 km/h.

    Once the cameras were taken down, speeds went back up. On Parkside Drive adjacent to High Park, were one camera was vandalized multiple times (with no arrests made), the number of motorists speeding 20 km/h or more than the 40 km/h speed limit went up 235%. In Ottawa, city data found that speeding went up considerably in school zones once the consequences were taken away.

    Active police enforcement remains a valuable tool because officers can lay charges that automatic speed cameras can not catch, including distracted, impaired, and dangerous driving. But policing has a dark history of racial profiling and has a pro-motorist “windshield bias,” while speed enforcement and red light cameras do not discriminate.

    Furthermore, North American roads are designed for excessive speed and not for the safety of vulnerable road users. We rely on signs to advise motorists of how we expect them to drive, rather than road design that requires attentive and slower driving. Speed cameras were a useful stopgap that worked a lot better than signage.

    So, the new supersized signs going up are not a solution to unsafe driving: they are just another mere indication that children, seniors, and all pedestrians and cyclists don’t really matter, especially to politicians like Doug Ford.

  • Spring intercity map update: new routes and new gaps

    Spring intercity map update: new routes and new gaps

    More Flixbus routes are coming to Western Canada

    In the fifth year that I have been following and mapping Canada’s intercity transportation links, the network (if you could call it that) remains in flux. Spring 2026 brings several new routes, particularly in Western Canada, that restore some former Greyhound services. Unfortunately, regional and commuter services in Ontario and Alberta are coming to an end. Wednesday, April 30 was the last day for the LTW Route 42 between Leamington and Windsor. In Alberta’s On-It is winding down its commuter buses between Calgary and Cochrane and Okatoks.

    However, Flixbus continues to expand, taking over more former Greyhound routes. Unlike Greyhound or most other intercity transport companies, Flixbus is not a bus company per se, as it does not own or operate the services; instead it uses smaller contracted operators while coordinating branding, schedules, and ticketing. But starting in May, it will operate three-four days a week between Calgary, Regina, and Winnipeg, with stops in cities that have long been without service, such as Moose Jaw and Swift Current. Another route will connect Calgary with Drumheller, including a stop at the famous Royal Tyrrell Museum.

    Despite the recent loss of TOK’s Southampton route and last year’s cutback of Grey County’s GTR services, there is hope for new connections in Midwestern Ontario. Grey County, together with neighbouring Bruce, Dufferin, and Wellington Counties, is studying a regional system to augment and replace the limited existing services. Hopefully, it will include regular service to fast-growing Saugeen Shores, which recently lost that TOK service. In Centre Wellington, a new local service connecting Elora and Fergus will soon start operations.

    One of the major issues continually faces is the lack of intramodality and useful connections. A viable passenger rail system — be it a classic corridor service such as the Quebec-Windsor VIA train or a high-speed line such as the planned ALTO project — is much more useful to many more passengers when there are easy connections at stations. Through-ticketing and schedule coordination should be implemented whenever possible. Furthermore, though the Upper Ottawa Valley (towns and cites such as Renfrew and Pembroke) has a daily Ontario Northland bus, it arrives in Ottawa late in the evening and leaves early in the morning, limiting its usefulness to areas closer to Ottawa that could benefit from a commuter connection or onward trips to Montreal, Toronto, or Kingston. Despite more gaps seemingly filled, other gaps remain.

    I updated my intercity transportation map to note these changes.  As always, please contact me with any information that I have missed. While I’ve tried to keep this map as accurate and up to date as possible, Canada is a big country. 

  • Ion: An Ontario LRT that somehow works

    Ion: An Ontario LRT that somehow works

    There is a light rail system in Ontario that works in the snow. ION LRT at University of Waterloo.

    Less than a two hours drive or train ride from Toronto, where that city’s first light rail line opened to universal disdain, a light rail line has been operating without incident for over five years. Trains operate like clockwork, signal priority works, and it has become the backbone of a regional transit system.

    Though the Ion LRT project was subject to several delays, opening eighteen months behind schedule, operations have been notably smooth since the public opening on June 21, 2019. The delay is attributed to Bombardier’s late delivery of their Flexity light rail vehicles, which were built on the same assembly line as the TTC’s new streetcars.

    A southbound Ion LRV turns from Charles Street to Borden Avenue. Note the white bar signal and the “no right turn – train” sign lit up.

    Funded by all three levels of government, the Ion LRT was constructed and operated by GrandLinq, a public-private partnership (P3) consortium that includes operator Keolis and engineering and construction firms such as Aecon, Kiewit, and Plenary Group. Though design-build-operate P3 models are common for Canadian transit infrastructure projects, they have their challenges, as Waterloo Region would later find out. Fares and service are integrated into the Grand River Transit bus system, which is owned and operated by the regional government.

    Waterloo Region is the smallest urban region in North America with a light rail system, and it works largely because of Kitchener-Waterloo’s geography. Many important regional destinations line up along the corridor: the terminals are both major suburban shopping centres that already functioned as major bus transfer points. In between the two malls are Downtown Kitchener and Uptown Waterloo, the two historic town centres, University of Waterloo, Wilfrid Laurier University, and Kitchener-Waterloo Hospital. The LRT serves or passes near all these destinations (though Laurier’s campus is centred a few blocks east of the LRT corridor). Furthermore, the region’s master plan focuses urban growth along the LRT corridor with new high-rise residential and mixed-use development. A planned extension of the LRT into Cambridge south to the historic Galt town centre will further support regional urban intensification goals.

    Ion trains operate every 10 minutes during weekday daytime hours; they operate every 15 minutes on weekends and weekday evenings, with 30-minute service from about 10:30 PM to the end of service starting around midnight.

    Map of Waterloo Region’s urban system, which directs growth to existing and planned transit corridors and limits growth outside the cities of Kitchener, Waterloo, and Cambridge. From the regional official plan.

    Despite following a linear corridor, the LRT winds its way along city streets, railway rights-of-way, and hydro corridors. This allowed the region to reduce property and road construction costs as well as achieve higher speeds in specific off-road sections. The fastest section is north of Uptown Waterloo, where the corridor makes use of a freight railway spur line between Kitchener and Elmira that also happens to run directly past University of Waterloo. In the south end, a different railway corridor and a hydro corridor allow trains to reach Fairview Park Mall on a mostly off-street alignment. These off-road segments are protected by railway signals and barriers, like those in along LRT lines in Calgary and Edmonton.

    This ability to switch between different alignment types is a clear advantage of light rail transit for medium-capacity transit systems. During overnight hours, freight trains headed to a plastics plant in Elmira use the same rails north of Uptown Waterloo as the LRT does during the day, making it an example of the “tram-train” model more common in Europe.

    The on-street sections, though slower than the off-road portions, provide access to Downtown Kitchener and Uptown Waterloo, including the planned new transit hub in Downtown Kitchener that will provide a better connection to GO Transit trains to Toronto. Unlike Toronto’s streetcars and Finch West LRT, however, the signal priority system works. On King Street between Downtown and Uptown, there are many intersections with traffic signals, but the LRTs generally do not have to stop at any of those red lights. At intersections, LRVs continue at regular speed, typically 40 km/h through this section.

    A southbound LRV on King Street. It just passed two signals with a clear (white vertical bar) signal; the next signal ahead will soon change to allow the LRV to proceed. Note that there are no “transit signal” signs, as Waterloo Region worked to have these approved by the province.

    Waterloo Region also worked to permit unique transit signals, which feature only white bar aspects. A vertical bar indicates “proceed” while a horizonal bar indicates “stop.” A flashing horizontal bar lets the operator know that it will soon switch to “proceed” while a flashing vertical bar warns of an upcoming stop signal. This reduces the sign clutter that is found on Toronto’s streetcar and light rail corridors.

    A typical Toronto assembly, with red, amber, and green transit signal aspects that look similar to the larger traffic lights above and accompanied with a “transit signal” sign. Of course, the Finch West LRV approached an amber signal, rather than being given a go ahead.

    To be fair, the advantage in Waterloo Region is that most of the on-street sections of the LRV corridor are on narrower urban streets rather than suburban arterials like Finch Avenue. King Street and Charles Street in Kitchener only have two general traffic lanes and are not major throughfares (a provincially-maintained freeway between St. Jacobs, Waterloo, Kitchener, and Highway 401 absorbs much of this traffic). The regional government also widened a section of Weber Street to four lanes to divert traffic from King ahead of LRT construction. This resulted in the loss of about two dozen houses and businesses.

    But by maintaining a narrow right-of-way on King Street, the LRT runs with minimal delays. It is easier to provide aggressive transit signal priority with short pedestrian crossing distances, narrow intersections, and lower traffic volumes.

    The video below illustrates how the LRT runs along King Street northbound from Kitchener Central Station.

    View from the front of a train heading north towards Waterloo

    Despite the LRT working well, it is still far from perfect: there are several sections in which the trams crawl at a 10 or 15 km/h speed, particularly on the south end. At Hayward Avenue the route switches from a railway corridor to an alignment alongside Courtland Avenue; this section has two tight turns and crosses an industrial driveway. Had a few more properties been expropriated (at additional cost) this would not have been an issue. Until a proper protected pedestrian crossing is installed at a path connecting Trayner Avenue to Fairway Road (a critical pedestrian link that was overlooked during the planning phase), LRVs must also slow down along the hydro corridor approaching Fairview Park Mall.

    The P3 contract also limits the ability to make service improvements. In 2024, Waterloo Region proposed revising the LRT schedule to run trains every eight minutes during peak periods, but because of a fixed staffing contract, it would have resulted in 30-minute service after 8PM. Luckily, local transit advocates successfully opposed that change. Had the LRT been operated directly by Grand River Transit, they could have simply trained more operators on the LRT service, even transferring bus drivers to the rail division.

    Overall, however, the LRT works in Waterloo Region both as a transit service and a planning tool. It provides useful lessons on what to do (real signal priority and proper signal aspects, make effective use of on-street and off-street routing where each makes sense), and what not to do (enter strict operating contracts) when building a new transit line. Waterloo Region made its rail transit work for its geography and its needs, and that is the most important thing.

  • Intercity map updates for April 2025

    Intercity map updates for April 2025

    New GO Transit bus stop on Chiefswood Road at Six Nations

    As we enter Spring 2025, there are a few significant changes in Ontario’s intercity transportation services. A new daily GO Transit route will now connect Six Nations and the Mississaugas of the Credit First Nation with Brantford, Hamilton, and Greater Toronto. A new seasonal Waterloo-Burlington weekend express could foreshadow more direct service between Kitchener/Waterloo and Hamilton in the future. Flixbus moved its Ottawa terminal stop to the VIA Rail station, joining Ontario Northland and Orleans Express.

    However, there are also some cuts, triggered by the end of the Ontario Intercommunity Transportation Grants. Grey County will terminate all GTR services with the exception of Route 1 between Dundalk, Shelburne, and Orangeville. T:GO is ending its intercommunity services outside of Tillsonburg, including routes that connect with Woodstock and London. PC Connect is cutting its rural route that serves places like Mitchell and Milverton (though routes connecting Listowel, Stratford, and St. Marys to Kitchener/Waterloo and London will continue).

    Unfortunately, T:GO will end all intercommunity bus routes outside of Tillsonburg, including the link to Woodstock

    Recently, I provided my expertise mapping Canada’s intercity transit links to Transport Canada, which allowed me to enhance and update the interactive map. I am also working with Transport Action Canada to support their efforts advocating improved intercity transport across the country.

    I will be retiring my older Ontario and Canada intercity maps; a new version of my Canada Intercity Map for 2025 can be found here. I will make all updates to a single map for now on. The new map depicts discontinued bus routes, shown in light grey.

    Preview of the new Canada Intercity Transport Map

    As always, please contact me with feedback, corrections, or updates. It is a challenge continually maintaining a Canada-wide map given how frequently things change.

  • Why transit system maps matter

    Why transit system maps matter

    I love maps, especially physical, paper maps. I like to visualize the places I travel to and determine how each city and region’s transit networks work. Though online interactive maps can be very helpful (like the ones I created to show all intercity transport services in Ontario and across Canada, filling a much-needed gap), there is still nothing like a well-designed static map, especially when it is in print and easily accessible to the public.

    This means providing maps that accurately and clearly depict the entire transit system, along with landmarks, connections, and frequency. Los Angeles Metro’s system map does a reasonable job for a map that covers a very large region.

    The Los Angeles Metro system map depicts the complex bus and rail network, including non-LA Metro agencies like Culver Citybus and Santa Monica’s Big Blue Bus. Colours and line width used to denote operator, service type, and frequency.

    Thankfully, most urban transit systems in North America continue to provide proper system maps both on their websites and in print, provided free on request at subway booths or terminal offices. (Some, however, have charged a small fee for a physical copy of their transit maps, such as San Francisco’s Muni.) In Europe, complete transit maps often have to be purchased, such as in Berlin or Vienna.

    I recently visited two mid-sized American cities that have done away with physical maps for their transit systems: Pittsburgh, Pennsylvania and Denver, Colorado. In those cities, figuring out how to get around by tram and bus was frustrating, even in an age of Google and Apple maps and transit planning apps accessible to anyone with a smartphone.

    Pittsburgh Regional Transit (formerly known as Port Authority Transit) operates a complicated web of bus routes that radiate from the city’s downtown core, along with a few cross-town and feeder routes. There are three busways and a light rail service to the southern suburbs. However, there is no proper system map, either in print or online as PDF or image file that allows the new or casual user to make sense of the network.

    Individual bus and LRT route schedules can be found under the Schedules tab on the PRT website, but one needs to know what route they are looking for. Under Rider Info, there is a link to a system map, but it takes the user to an ESRI interactive map.

    Screenshot of the system map page of the PRT website

    The user can then select a service by route name or number in a drop-down tool, but the map itself is difficult to figure out. Zooming in reveals the location of fare vendors and park-and-ride lots, but not important service details like route numbers or service frequency.

    Zooming in, park-and-ride lots become the most prominent feature

    Even at the neighbourhood level the map is difficult to read. The screenshot below shows Pittsburgh’s Oakland district, home to University of Pittsburgh, Carnegie Mellon University, several other educational institutions, medical centres, parks, museums, and cultural venues. Many bus routes follow Forbes Avenue and Fifth Avenue, but as each route is layered on top of each other, it is difficult to discern where each route runs and where they go.

    PRT’s ESRI interactive system map, zoomed into the Oakland District

    Denver’s Regional Transportation District (RTD) also uses ESRI interactive maps to show bus routes (rail services are depicted in a static image map as well). At a small scale, only the light rail and commuter/regional rail services appear, along with transit park-and-ride locations. Denver’s bus system is less complicated than Pittsburgh, operating largely on a grid, but still, a proper map would make it much easier to get a sense of the network.

    RTD System Map zoomed out

    Zoom in, and bus routes appear, along with route numbers, but there is nothing to show the level of service for each route.

    Though online-only interactive maps have their purpose (my Ontario and Canada intercity maps are designed to show where connections exist, or not, and how to obtain schedule information), they are not well suited for urban transit systems and are very difficult to read on a mobile device. Properly designed static maps, in web image or PDF format do much better jobs.

    It is worth comparing Pittsburgh and Denver to the Toronto Transportation Commission (TTC). The TTC’s complete system map is provided to customers for free at subway stations, with smaller, simplified versions available as tear-away pamphlets. Large-format versions are also displayed across the network in bus shelters and subway stations. A PDF version can also be easily found on the TTC website in the main Routes and Schedules page. Surface routes are categorized by service level (express, frequent service, regular service, limited service, seasonal, and community routes) with major landmarks and transfer points to connecting services clearly indicated.

    I have some minor complaints about the TTC’s map (like regular routes, express routes should be categorized in the map based on their service levels, for instance) but it is a reasonable, easy to read map that is also quite easy to find.

    Unfortunately, more transit systems are moving away from easily accessible paper maps. Durham Region Transit, for example, no longer provides copies of its system map. Fortunately, a proper, well-designed PDF copy remains accessible on its website.

    When travelling, or looking to understand a city’s transit network though, there is nothing quite like poring through a well-designed, easy-to-read paper map. It would be a shame if more agencies went the way of Denver and Pittsburgh.

  • A review of Metrolinx’s April 2024 service changes

    A review of Metrolinx’s April 2024 service changes

    With a GO train serving as a backdrop, Premier Doug Ford, along with Transportation Minister Prabmeet Sarkaria, announced major changes to GO Transit service, with 300 new weekly trains (a 15% service increase). The service changes will take effect on Sunday, April 28, 2024.

    Though most new trains will be added on the Lakeshore West, Lakeshore East, and Kitchener Lines (the Milton Line gets just one additional weekday round trip in the peak direction), the media event was held in Milton, where a byelection was called to replace outgoing PC MPP Parm Gill. With a competitive race between PC candidate Zeeshan Hamid and Liberal candidate Galen Naidoo Harris, the choice of venue made it an especially political event.

    News of the pending service changes was publicized in regular Metrolinx email newsletters in March, but was since taken down, likely to allow for the news to be shared first by the premier and minister of transportation. It is quite clear that Metrolinx is entirely beholden to the provincial government these days, where communications are tightly controlled by its political masters.

    The new GO Transit schedules are now available online. Though there is plenty of good news, some of the added trains are merely restoration of previous service levels. Meanwhile, there will be a significant service cut for two Toronto stations.

    Lakeshore Corridor

    Fifteen-minute train service returns on the busy Lakeshore line on weekend afternoons and evenings, between Oshawa and Oakville Stations only. Service will still run every half-hour on weekdays, weekend mornings, and to Bronte, Appleby, Burlington, and Aldershot Stations, and every hour to West Harbour GO in Hamilton.

    However, weekend 15-minute service starts late in the afternoon. Frequent service from Oakville to Union starts at 2:30 PM Saturdays and Sundays and at 3:14 at Union Station. This additional service starts too late for family day trips to the city or for getting to afternoon Blue Jays games.

    Bus route 18K, which operates between Aldershot, West Harbour, St. Catharines, and Brock University, is renumbered to Route 11.

    Milton Corridor
    Map of Route 21

    There will be one new peak-period round trip leaving Milton at 6:43 AM and leaving Union at 4:10 PM.

    More importantly, Route 21 will return to its previous routing, operating directly into Union Station Bus Terminal. When I wrote about the April 2023 changes, I commented that the changes simplified the complicated Route 21 while improving reliability and predictability for Milton Line passengers. However, the changes proved to be unpopular, with poorly timed connections between buses and trains.

    But with the Gardiner Expressway down to two lanes between Dufferin Street and Strachan Avenue for long-term construction, and with downtown Toronto’s traffic, I am wondering how much better the ride will be.

    Route 21A, which ran between Milton and Oakville, will be replaced by Route 22, which offers much more limited service — every two hours, weekdays only. Route 21A offered useful connections to GO buses at Trafalgar Road Park & Ride for Highway 407 services to McMaster University, Downtown Hamilton, Square One, and beyond. It is a shame to see that service reduced, though perhaps Milton Transit should begin serving it.

    Kitchener Corridor and UP Express
    New UP Express service pattern

    The good news? There will be new weekday half-hourly train service between Bramalea and Union Stations during midday and early evening periods. (Hourly service between Bramalea and Union will remain in the counter-peak direction.) There are no changes to rail service between Kitchener, Mount Pleasant, or Union Station and only minor changes to connecting GO buses. Not all trains will stop at Etobicoke North, which only has one platform.

    The bad news? UP Express service will be split into express and local services, with non-stop service between Union Station and Pearson Airport every 30 minutes, and local trains every 30 minutes stopping at Bloor and Weston. Both local stations will see improved weekday GO service, but this still amounts to a service cut, especially at Bloor, an important connection to the Line 2 Subway and local TTC services. This is also at a time when the connection between Dundas West Station and Bloor Station is finally being improved.

    Other changes

    Weekday evening train service will be restored on the Stouffville Line on April 28.

    Elsewhere, there are minor schedule adjustments — it’s always a good idea to check your trip before you depart.

    One last thing worth commenting about is a brand new, well-designed GO Transit bus map that clearly shows each route and how they connect to the rail network. Bus routes are sorted into “core” and “train support” services, a useful distinction.

    My only criticism is that they should show frequency or level of service — some “train support” routes run hourly or better, seven days a week (like Route 30) while some of the “core” routes do not operate evenings and weekends.

    Regional bus map
    Finally

    Apart from my observations and criticism above, I would have liked to have seen more changes to the bus network. For example, service to Peterborough remains too slow, while there should be weekend service between Kitchener, Guelph, and Hamilton. Hopefully, there will be more changes in September.