Category: Canada

  • Canada Intercity Transport Map, updated for Fall 2024

    Canada Intercity Transport Map, updated for Fall 2024

    There are buses to more destinations in 2024, but a few major gaps persist

    NOTE: Previous versions of the Ontario and Canada maps are retired; please see the new Canada Intercity Transport Map, launched March 30, 2025. This will now be the only interactive map that I will update.

    After completing my Ontario Intercity Transportation Map updates for Fall 2024, coinciding with a ride from Hamilton to Haldimand County on Southern Ontario Transit, I turned my attention to the rest of Canada.

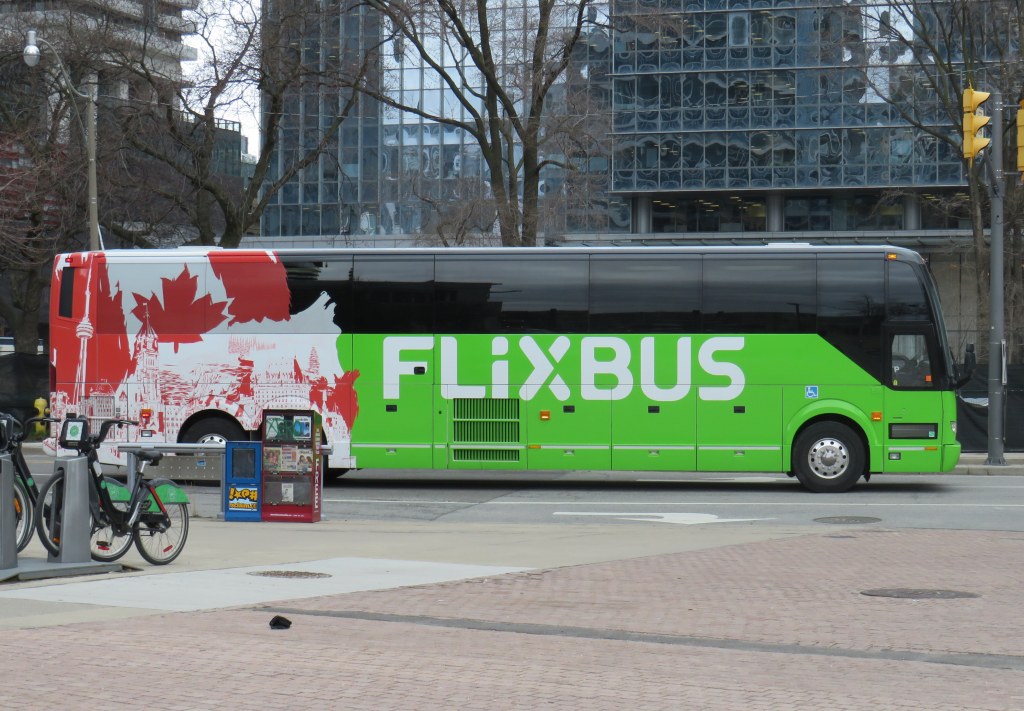
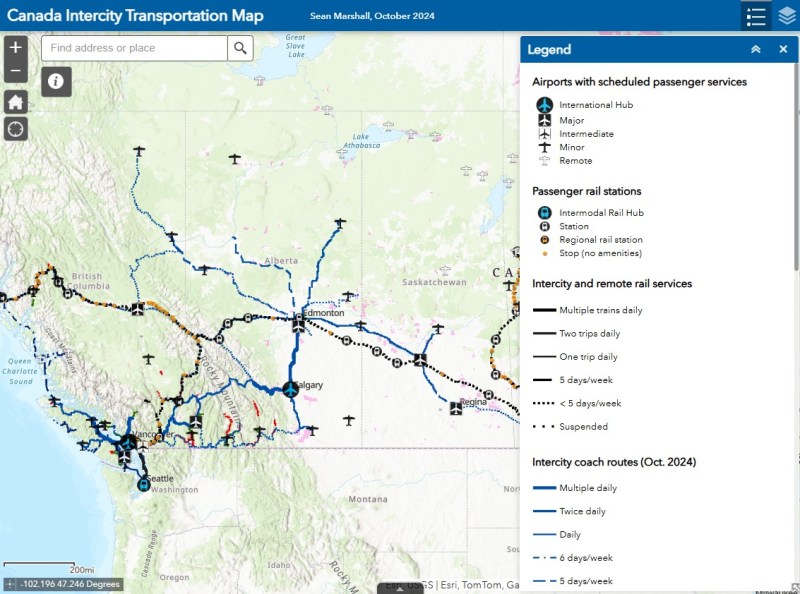
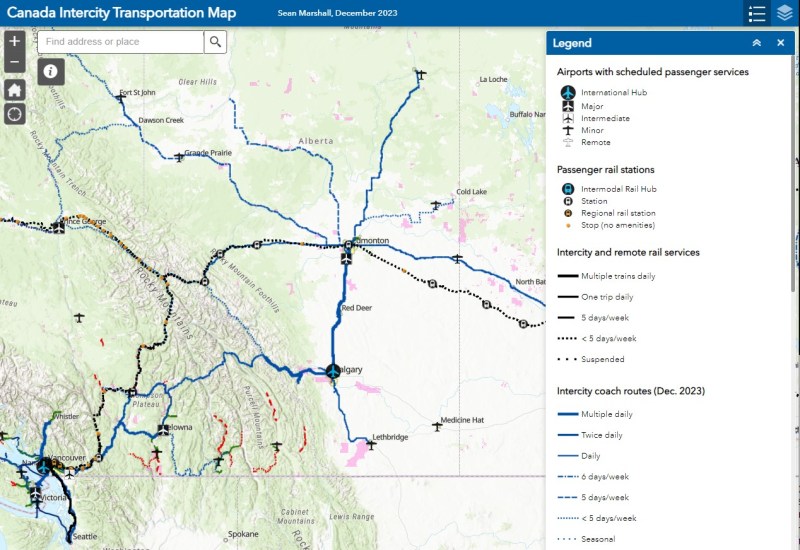
    Unfortunately, outside of Ontario, there not that many updates to make. On Vancouver Island, at least, there is now daily service all the way to Port Hardy in the north and Tofino and Ucluelet to the west, with additional runs between Comox, Nanaimo, and Victoria. There are more buses between Vancouver and Seattle; FlixBus is now operating on the busy Calgary-Edmonton and Calgary-Banff routes. There is also a new twice-weekly Edmonton-Camrose service, thanks to work by the University of Alberta’s student union; it partnered with FlixBus to provide the service.

    (FlixBus’ Downtown Calgary stop, in a parking lot behind an abandoned building in the Belt Line neigbourhood leaves a lot to be desired. Edmonton’s, at an abandoned car dealer on Jasper Avenue, isn’t any better.)

    Also new to the map is Mountain Man Mike’s bus service between Vancouver, Nelson, Kaslo BC, and Calgary, as well as Mobilité Charlevoix, a regional service that connects several towns east of Québec City including Baie-Saint-Paul, La Malbaie, and Clermont.

    Unfortunately, several wide gaps remain. Despite plenty of competition on the busiest routes in Southern Ontario and Alberta, there is no bus service between Calgary and Regina, leaving cities like Medicine Hat and Moose Jaw without intercity connections, apart from airport shuttle services, despite once-frequent Greyhound service. Between Winnipeg and Regina, it is still just one bus a week. Maritime Bus, for whatever reason, still has not restored service across the New Brunswick-Québec provincial line.

    Without comprehensive government-led coordination and support, these gaps are likely to remain unfilled.

    October 2024 Canada Intercity Transportation Map

    You can read more about how I created these maps here.


    If you like this post and you would like to help out with my online mapping and webhosting costs, consider buying me a coffee. Thank you!

  • Changing tracks: passenger rail in 1980 and 2024

    Changing tracks: passenger rail in 1980 and 2024

    A VIA Rail train in Stratford, Ontario. In 1989, there were five trains a day connecting Stratford to Toronto. In 2024, there is only one.

    July 2024: Map edited to include one new daily intercity train: Amtrak’s Borealis, an extension of an existing Chicago-Milwaukee train to St. Paul, Minnesota, offering a second daily train on the eastern section of the Empire Builder route.


    Unlike in Europe or Asia, the story of passenger rail in North America the last seventy-five years has generally been one of decline. There are exceptions: service on the Northeast Corridor between Boston and Washington is frequent and relatively speedy. Commuter rail services have expanded in most major metro areas. And a new privately-owned intercity rail service in Florida offers frequent, dependable, and fast service between Miami and Orlando, with expansion on the way.

    The development of new interstate highways, the loss of mail contracts and express freight to trucking, more affordable air travel, and competition from coach operators all contributed to the decline in North America. Though Canada and the United States both established national rail passenger services in the 1970s in an attempt to halt — or at least manage — the disappearance of intercity rail, the two countries had vastly different operating environments. Mexico, which had a nationalized railway network, privatized its assets and wound down intercity rail in 1995; today there is now only a commuter train in Mexico City and a new tourist-focused Tren Maya service in the Yucatan Peninsula.

    Canada had only two major railway systems since the 1920s: privately-owned and profitable Canadian Pacific, and government-owned Canadian National. There were only several smaller railways owned by provincial governments and industrial concerns, along with a few American connections such the New York Central (NYC) line through southwestern Ontario, and the Toronto, Hamilton and Buffalo Railway, a joint venture of CP and NYC.

    In the United States, there were dozens of medium and large railroads, all competing for fewer passengers and depleting natural resources. In the Northeast and Midwest, mergers between one-time rivals like NYC and Pennsylvania Railroad (Penn Central) and the Erie and Delaware, Lackawanna and Western Railroads (Erie Lackawanna) failed, leading to the creation of federally-backed Conrail. (Today, there are only six Class I railroads in the US, including CN and CP-Kansas City Southern)

    In the midst of failing railroads and declining passenger services, Amtrak was formed in 1971 and took over the operation of most remaining intercity trains. (Commuter trains, often subsidized by local or state governments, remained operated by the freight railroads before being absorbed by transit agencies.) Amtrak purchased new rail cars for regional services to replace decrepit rolling stock (Amfleet); eventually new long-distance cars were also acquired one it was clear it would maintain those routes (Superliners)

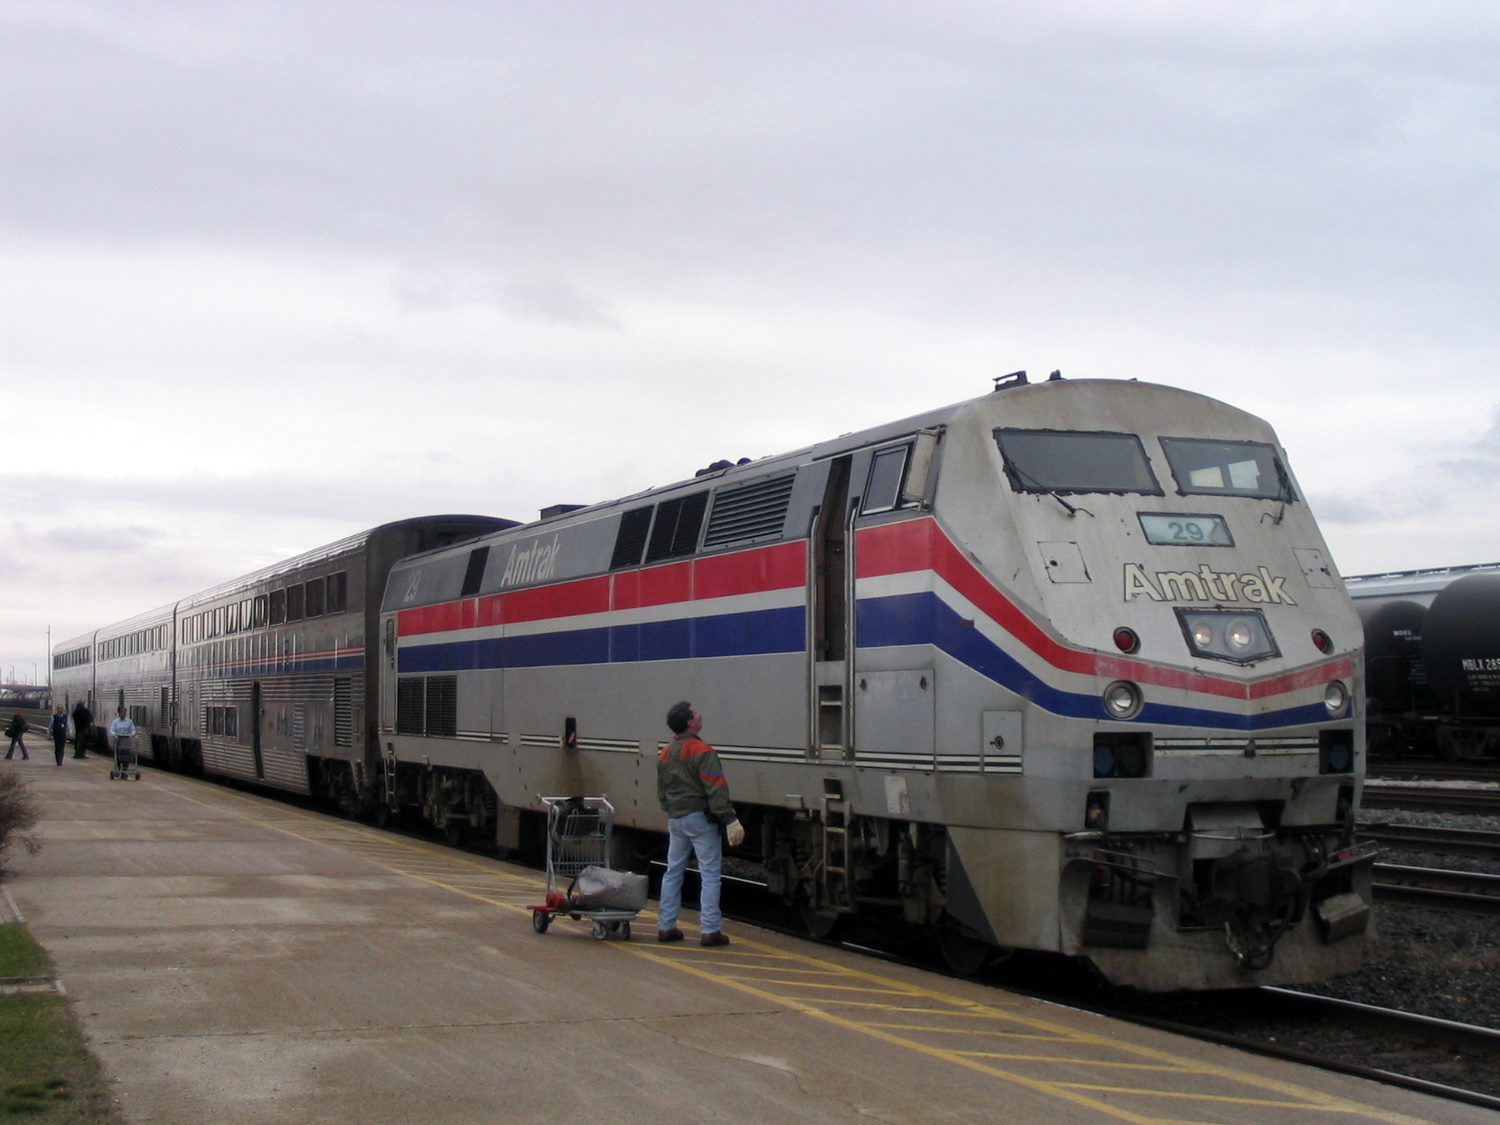
    Amtrak’s “International” in Sarnia, Ontario in 2004, equipped with Superliner coaches

    In Canada, VIA Rail started off in 1976 as a passenger rail brand of CN, which, as a Crown corporation, was still committed to passenger services. In 1977, it became a separate agency and in 1978, it took over CP’s remaining rail services. The 1980 map shows what VIA Rail’s system looked like in the early years. VIA did not take over everything; CN and CP retained ownership of commuter trains in the Montreal area, which were not yet assumed by the regional transit agency there. Railways not owned by CN and CP also maintained their own passenger services, usually with government support or direct provincial operation (i.e., GO Transit, Ontario Northland, BC Rail, Algoma Central).

    Both Amtrak and VIA saw major funding cuts from federal governments in the first decade of their existence. In the United States, poorly-performing routes such as the Mountaineer (Norfolk-Cincinnati-Chicago), the Floridian (Chicago-Nashville-Miami), the Lone Star (Chicago-Kansas City-Oklahoma City-Houston) and the National Limited (Washington-Columbus-Kansas City) were eliminated between 1977 and 1979; deteriorating track conditions on insolvent host railroads were a contributing factor.

    VIA Rail also saw several service cuts after its formation. Though the trains eliminated between 1977 and 1980 were generally marginal services in Western Canada and Northern Ontario and Quebec, 1981 saw more drastic cuts across the country, including the elimination of CN’s transcontinental train through Saskatoon and Edmonton. Though those cuts were partially reversed in 1985, in 1990, nearly half of VIA’s trains were wiped from the timetable, including nearly every train in the Maritime Provinces and the famed Canadian on the CP route from Montreal and Ottawa through Thunder Bay, Regina, Calgary and Banff.

    Amtrak, despite its challenges, never saw cuts as drastic as those made to VIA Rail. Unlike VIA, Amtrak enjoys more autonomy from the federal government. Many of its services are funded by state governments rather than the federal government. Powerful senators will lobby to maintain services or add new trains in their state. (Canadian federal politicians generally enjoy less influence and autonomy in our parliamentary system, with power increasingly centralized in the Prime Minister’s Office.)

    Amtrak routes added since 1980 and depicted in the map below include the restoration of previously eliminated services. The Heartland Flyer (Oklahoma City-Fort Worth) is a partial restoration of the Lone Star, while Amtrak Regional service to Roanoke, Virginia, restores part of the cancelled Mountaineer. There are three daily transcontinental trains between Chicago and the West Coast and two between New York, Washington, and Florida. Daily service means these long-distance trains are much more useful for regular and casual travelers than VIA’s remaining long-distance trains.

    Over a dozen states contribute to the operation of many daily trains. California goes even further, with a distinct Amtrak California brand with a dedicated fleet owned by that state’s department of transportation. If such a model existed in Canada, one might expect the continuation of services such as Toronto-Peterborough, Montreal-Sherbrooke, or even Calgary-Edmonton.

    Bucking the trend: commuter rail

    Unlike intercity passenger rail, commuter rail services have expanded in Canada and the United States. In 1980, there were only 11 metropolitan areas with commuter rail services (and in Pittsburgh and Detroit, those would soon disappear). In 2024, there were 23. Though systems in the New York and Chicago areas barely expanded (and in Philadelphia, commuter rail coverage actually shrunk), there was impressive growth in commuter services in the Greater Toronto Area, the San Francisco Bay Area, and in Southern California, to the point that GO Transit and Caltrain are evolving towards becoming true regional rail systems.

    Interactive map

    An interactive map, linked below, shows what the Amtrak and VIA Rail systems looked like in 1980 and in 2024, along with independent railways and commuter services. The 1980 map includes notable routes (in grey) that were cut since 1976, the year of America’s bicentennial and the Summer Olympics in Montreal. Use the slider to compare the two maps and click on any line for more details on each route.

    Link to interactive map

    For a comparison of Canadian passenger rail services between 1955 and 1980, please visit my previous post here.

    The Museum of Railway Timetables website is an invaluable archive of Amtrak system timetables; I consulted it many times in the making of this latest map.


    If you like this post and you would like to help out with my online mapping and webhosting costs, consider buying me a coffee. Thank you!

  • Mapping Canada’s intercity links

    Mapping Canada’s intercity links

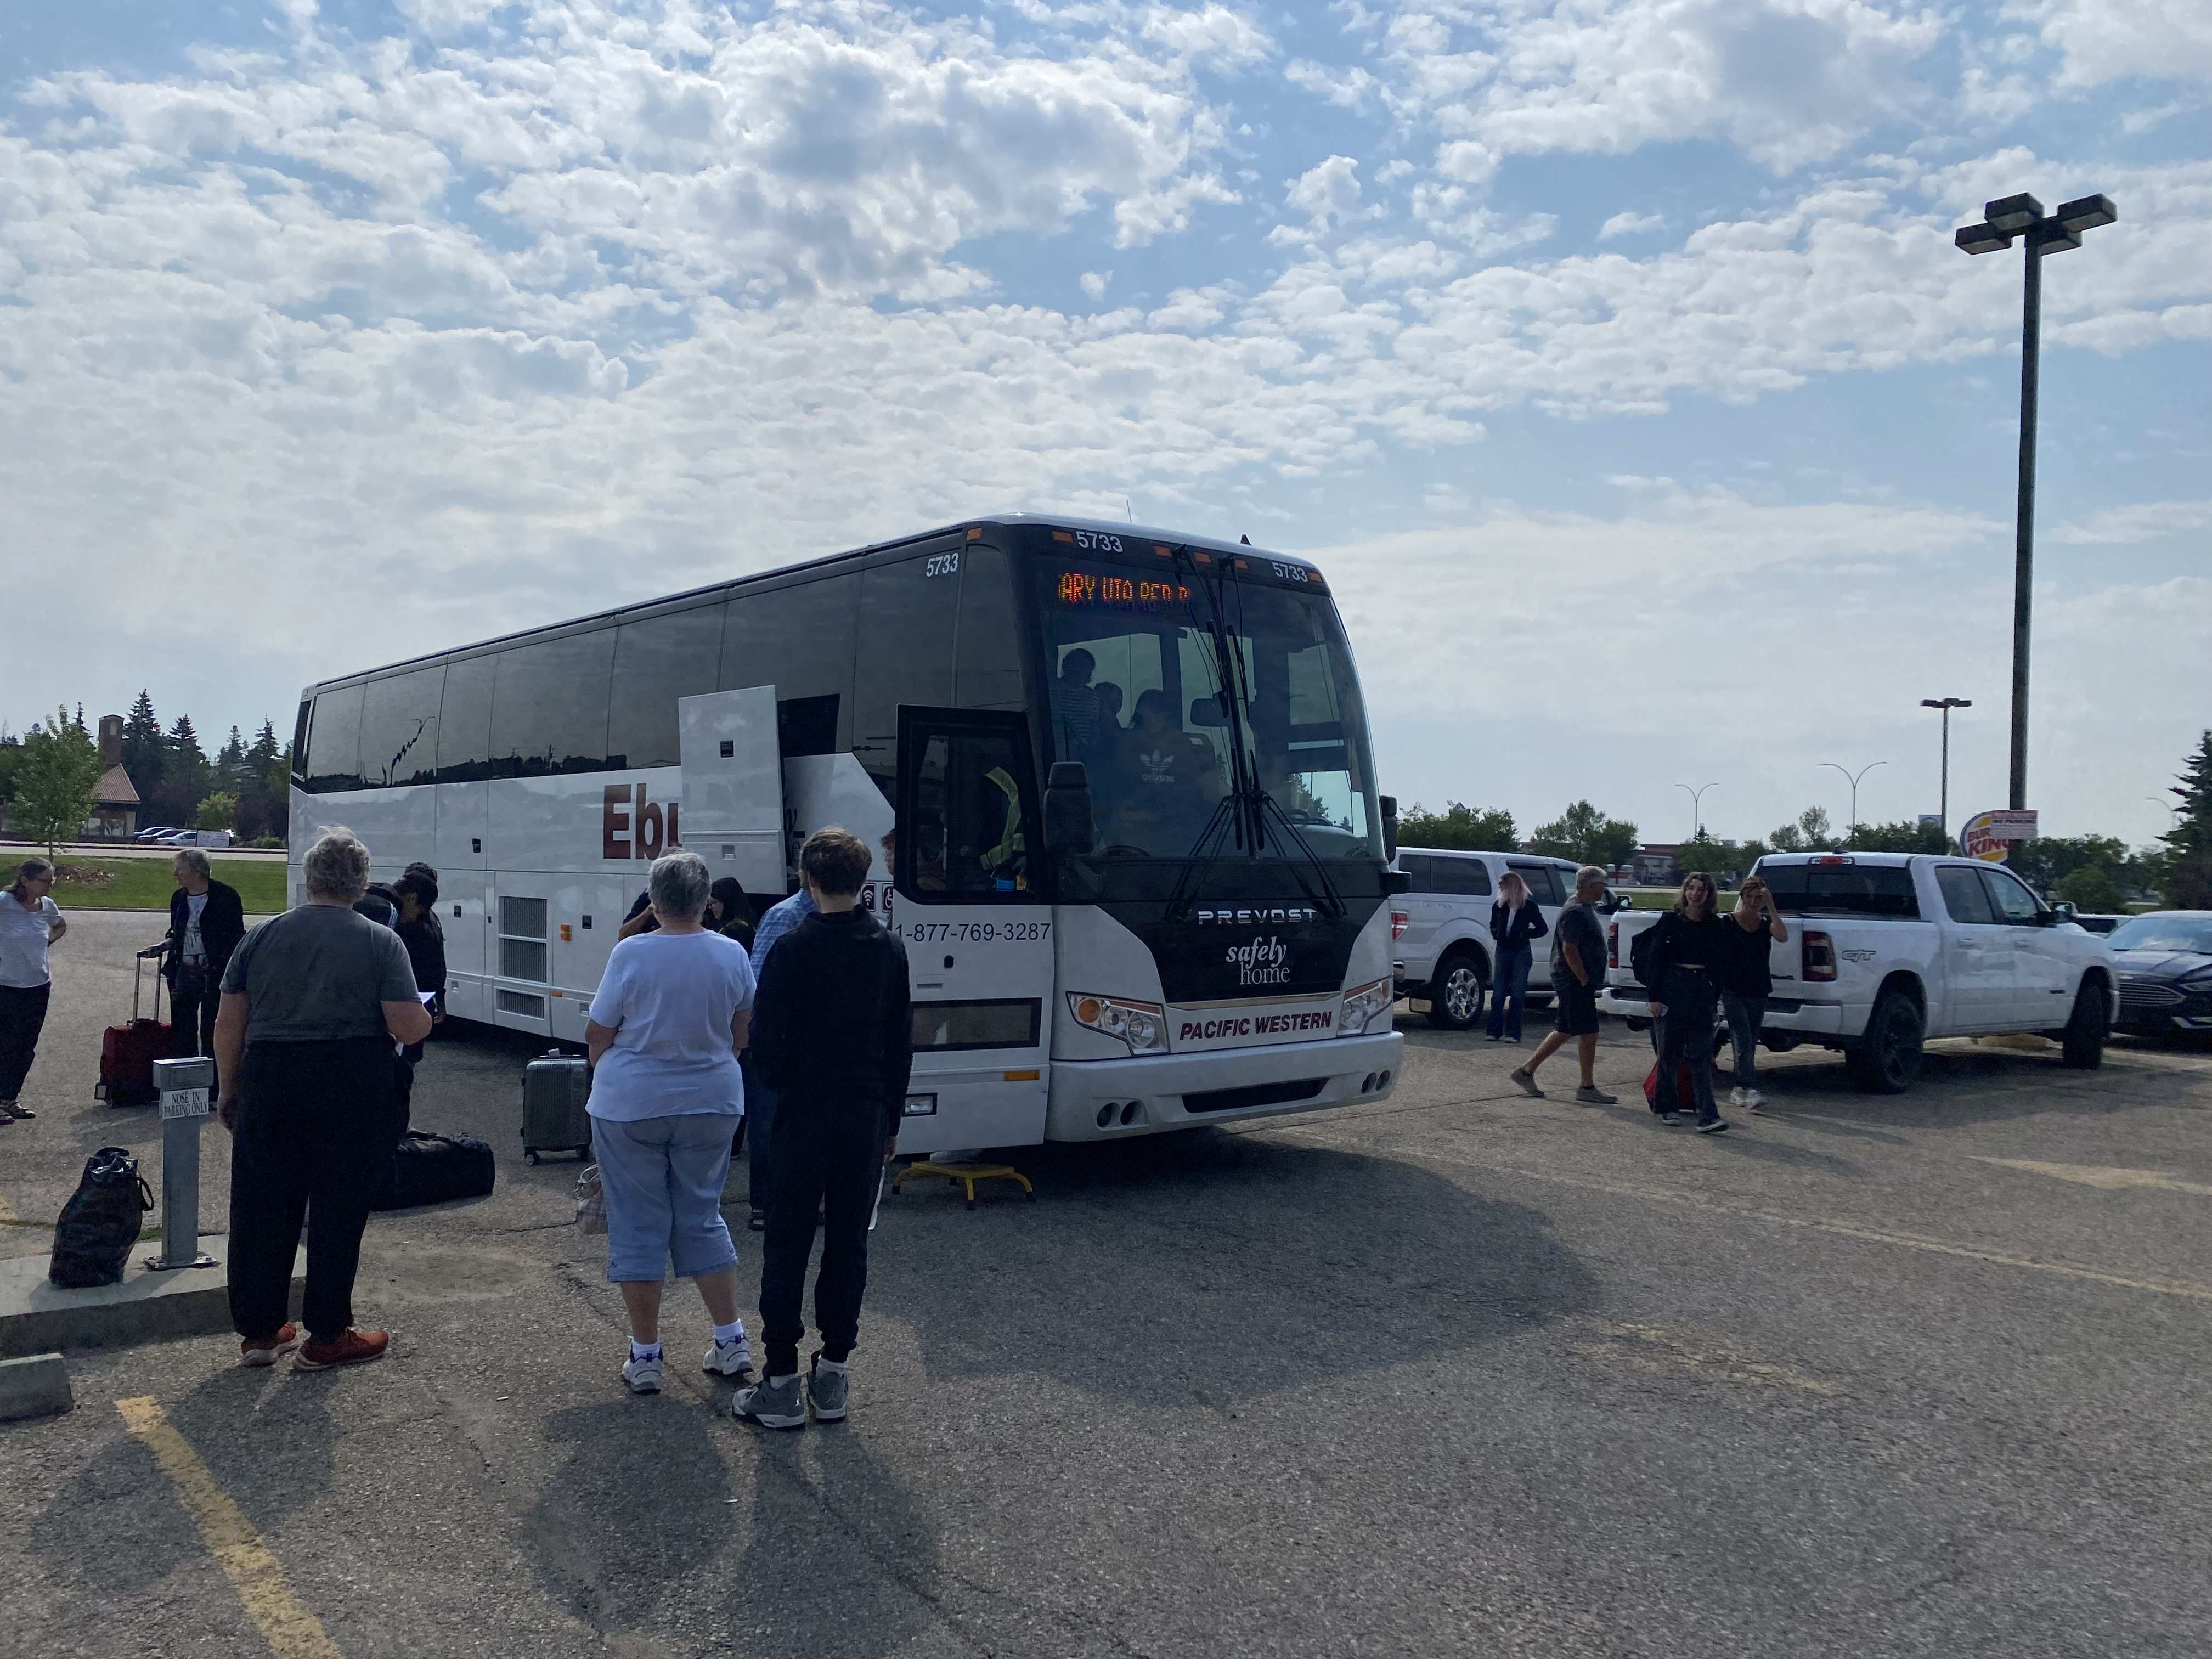
    A Calgary-bound Pacific Western Ebus Coach loads at Red Deer, Alberta

    NOTE: Previous versions of the Ontario and Canada maps are retired; please see the new Canada Intercity Transport Map, launched March 30, 2025. This will now be the only interactive map that I will update.

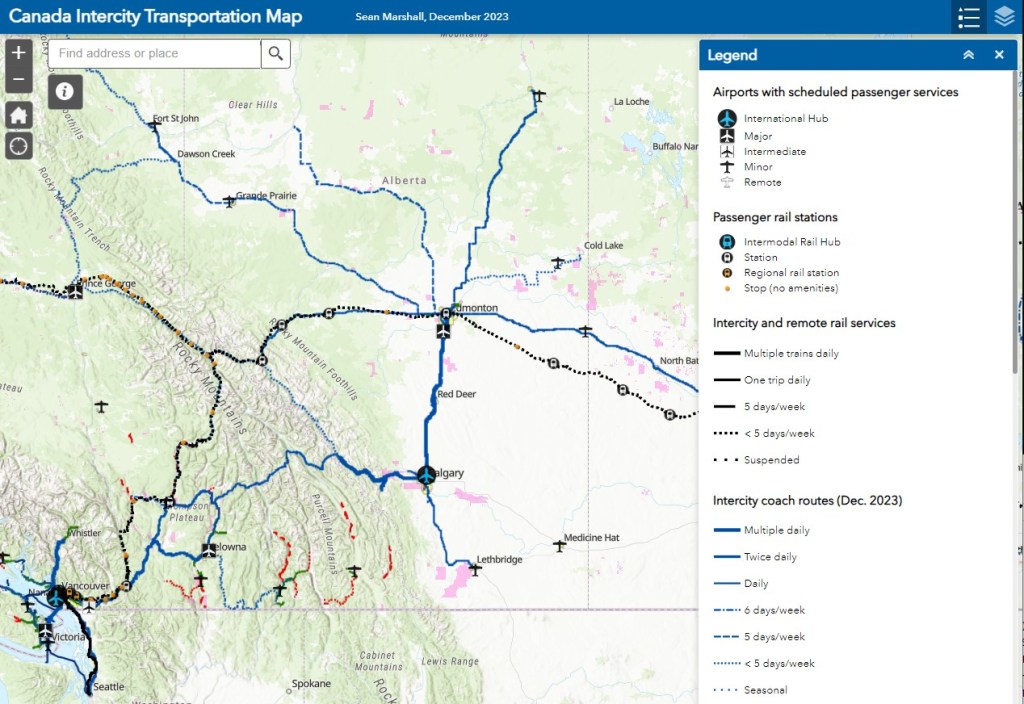
    In 2022, I was approached by staff at Infrastructure Canada who were interested in compiling information on intercity bus services across the country. Unfortunately, no repository had existed for a very long time, especially as transit and intercity coach services are primarily under provincial and municipal jurisdiction. Ontario’s provincial government last published a map of intercity carriers in 1990-1991, while Saskatchewan abolished its provincial bus service in 2017. The withering of Greyhound Canada’s once-extensive network left many communities from Ontario west to British Columbia and the Yukon without any service, while new private operators like Ebus and Rider Express filled in to serve the most lucrative routes.

    Though the Federal Government operates VIA Rail and oversees air, marine, and long-distance rail transport, for road and city transport, its role has been more limited to helping to fund transit projects and some major road infrastructure improvements. Knowing that, I was excited to learn that there was interest in understanding the state of the country’s rural and intercity transport initiatives. I completed the project for Infrastructure Canada in June 2023, but I have recently updated a version of the map I completed, which I am excited to share.

    A simplified methodology of how I completed this map can be found below.

    Canada-wide intercity transportation map
    (more…)
  • Wards and ridings: not quite representation by population

    Wards and ridings: not quite representation by population

    When Statistics Canada released the first batch of 2021 Census data, it made the new population counts available for a wide variety of geographies, from provinces and cities, to local census tracts and even city blocks. It also released data for the 338 federal electoral districts, better known as ridings.

    Because of constitutional requirements, the seats in the federal House of Commons are not allocated equally by population. For example, Prince Edward Island, with a population of 154,331, has four seats. At the other extreme, four electoral districts in Alberta and one in Brampton, Ontario have larger populations than Canada’s smallest province.

    Electoral DistrictProvince/Territory2021 Population
    LabradorNewfoundland & Labrador26,655
    EgmontPrince Edward Island35,925
    NunavutNunavut36,858
    CharlottetownPrince Edward Island38,809
    MalpequePrince Edward Island39,731
    Average109,444
    Banff-AirdrieAlberta155,580
    Calgary SkyviewAlberta159,642
    Brampton WestOntario162,353
    Calgary ShepardAlberta163,447
    Edmonton-WetaskiwinAlberta209,431

    The federal electoral districts were last drawn in 2013, following the 2011 census. As a result, fast-growing ridings, particularly in Southern Ontario, Calgary, and Edmonton, have huge populations compared to the national average.

    In Ontario, the provincial government uses the same boundaries for its provincial electoral districts, with the exception of Northern Ontario, where two additional seats help to compensate for the area’s vast and remote regions, where local MPPs may have to travel hours by car, train, or plane to meet constituents. The province imposed the same boundaries on the City of Toronto in 2018, in the middle of a municipal election for which new, fairer boundaries were just approved.

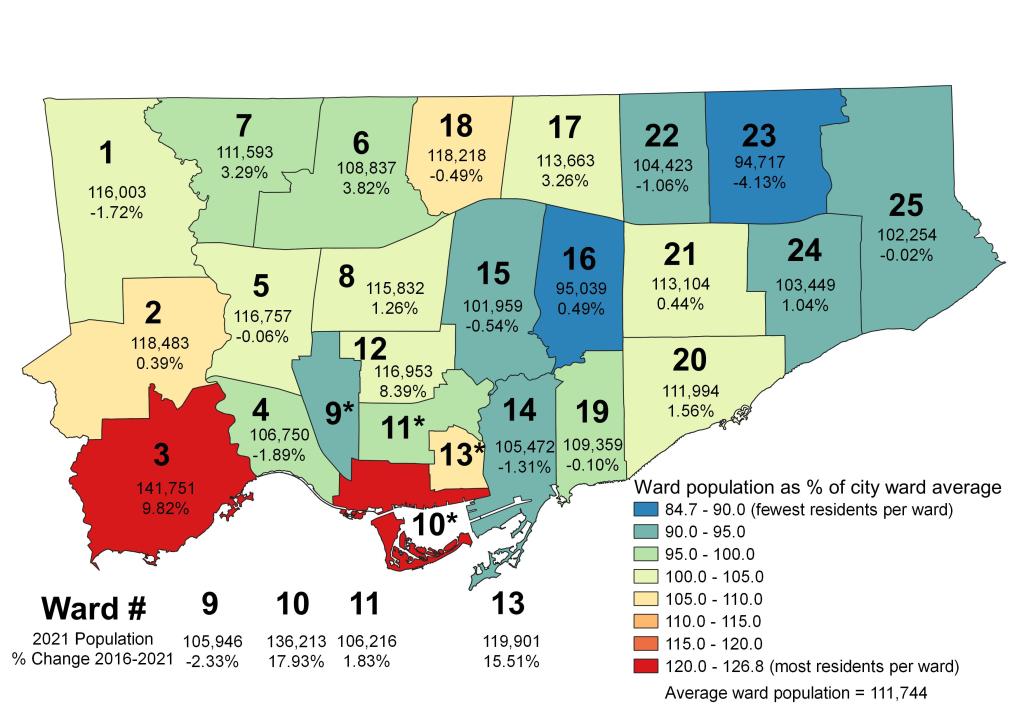
    By 2021, the population differences based on decade-old data became stark, as shown in the map below.

    Map depicting disparities in Toronto’s ward populations

    Ward 23 Scarborough North, represented by Cynthia Lai, has a population of 94,717. Ward 23’s population dropped by over 4% since 2016, as households age and few new housing units built in that ward. Ward 16, Don Valley East, has just 95,039 residents, with a stable population.

    On the other extreme, Ward 3 Etobicoke-Lakeshore, represented by veteran councillor Mark Grimes, has a population of 141,751, growing by 9.82% since 2016. New condominium developments in the Humber Bay neighbourhood and along the Queensway have driven much of that growth. Ward 10, Spadina-Fort York, saw an even greater number of new residents move in, growing by nearly 18% in the last five years.

    As Toronto is stuck with these ward boundaries until 2026, the population disparities will only grow larger, with downtown and South Etobicoke residents becoming even more underrepresented. Compounding the unfairness is that councillors representing high-growth wards have much higher workloads, as they deal with mountains of planning applications while ensuring their existing constituents have access to essential local services like schools, transit, and park space.

    The ward boundaries initially set for the 2018 municipal election would have accounted for future growth, ensuring that workloads would be more fairly distributed, and that city residents would have equal access to their local councillor.

    The 2021 population counts will be used to set new federal riding boundaries, which will be drawn next year after a consultation period and used in the first federal election held after 2023. The province will likely adopt the new boundaries for the 2026 election (assuming a majority government is elected in June).

    Perhaps in four years, Toronto will be able to set its own ward boundaries again. That, of course, will depend on electing a better provincial government and a council committed to equity and good governance.

  • Mapping Toronto’s population growth

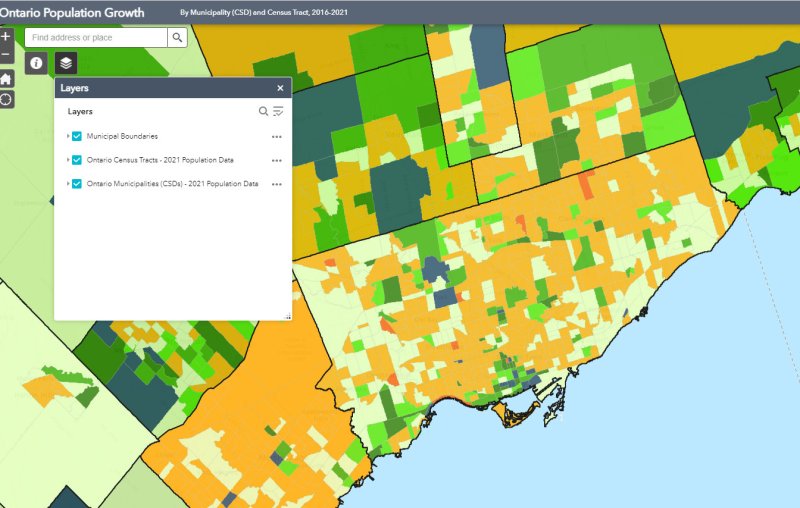
    Despite new highrise development in its city centre, Mississauga lost 3,368 residents between 2016 and 2011

    On February 9, data geeks across Canada rejoiced when Statistics Canada released the first round of data from the 2021 Census of the Population.

    The data was released at all levels of geography made available by Statscan. At the federal level, Canada grew by 5.2% since the 2016 Census, with a total population of 36,991,981. Immigration, rather than natural growth (births vs. deaths) drove Canada’s population increase.

    Of course, this growth did not occur evenly across the country. Newfoundland and Labrador lost residents, while Prince Edward Island and British Columbia saw the biggest population increases.

    Within the Greater Toronto and Hamilton Area, Mississauga experienced population decline (-0.5%) for the first time since it became a city in 1974. Outer suburbs, such as Milton, East Gwillimbury, and areas just beyond the GTHA, such as New Tecumseth and Bradford saw population growth over 20%, driven by new greenfield development.

    In older Toronto suburbs, including much of Etobicoke, North York, Scarborough, and even Mississauga, population losses at the local census tract level can be explained by ageing households, where Millennial and older Gen Z children moved out on their own, particularly into fast-growing downtown areas. These areas, dominated by single-family housing, could accommodate much of the GTHA’s growth with gentle density, including secondary suites (such as basement apartments), garden suites, and zoning policies that would make it easier and more economical to build “missing middle” housing such as walkup apartments and multiplex homes.

    Toronto grew by 62,785 residents in the last five years, with only a few areas accommodating all that growth: the downtown core between Dufferin Street and Broadview Avenue, South Etobicoke, Yonge-Eglinton, and former industrial, instructional, and commercial lands stretching along the Highway 401 corridor through North York and West Scarborough. This corridor includes the Downsview Park development, a new condominium cluster at Wilson Subway Station, the former Canadian Tire lands near Sheppard Avenue and Leslie Street, and the intensification of the Fairview Mall area.

    You can take a look at the changes for each municipality and each census tract in Ontario with an interactive map I created here.

    Population Change for GTHA Municipalities

    Municipality2021 Population2016 PopulationChange (%)Change (Total)
    Toronto 2,794,3562,731,5712.362,785
    Mississauga717,961721,599-0.5-3,638
    Brampton656,480593,63810.662,842
    Hamilton569,353536,9176.032,436
    Markham338,503328,9662.99,537
    Vaughan323,103306,2336.016,870
    Oakville213,759193,83210.319,927
    Richmond Hill202,022195,0223.67,000
    Burlington186,948183,3142.03,634
    Oshawa175,383159,45810.015,925
    Whitby138,501128,3777.910,124
    Milton132,979110,12820.722,851
    Ajax126,666119,6775.86,989
    Clarington101,42792,01310.29,414
    Pickering99,18691,7718.17,415
    Newmarket87,94284,2244.43,718
    Caledon76,58166,50215.210,079
    Halton Hills62,95161,1612.91,790
    Aurora62,05755,44511.96,612
    Whitchurch-Stouffville49,86445,8378.84,027
    Georgina47,64245,4184.92,224
    East Gwillimbury34,63723,99144.410,646
    King27,33324,51211.52,821
    Scugog21,58121,617-0.2-36
    Uxbridge21,55621,1761.8380
    Brock12,56711,6427.9925

  • You can’t get there from here: Union Station’s lost cities

    You can’t get there from here: Union Station’s lost cities

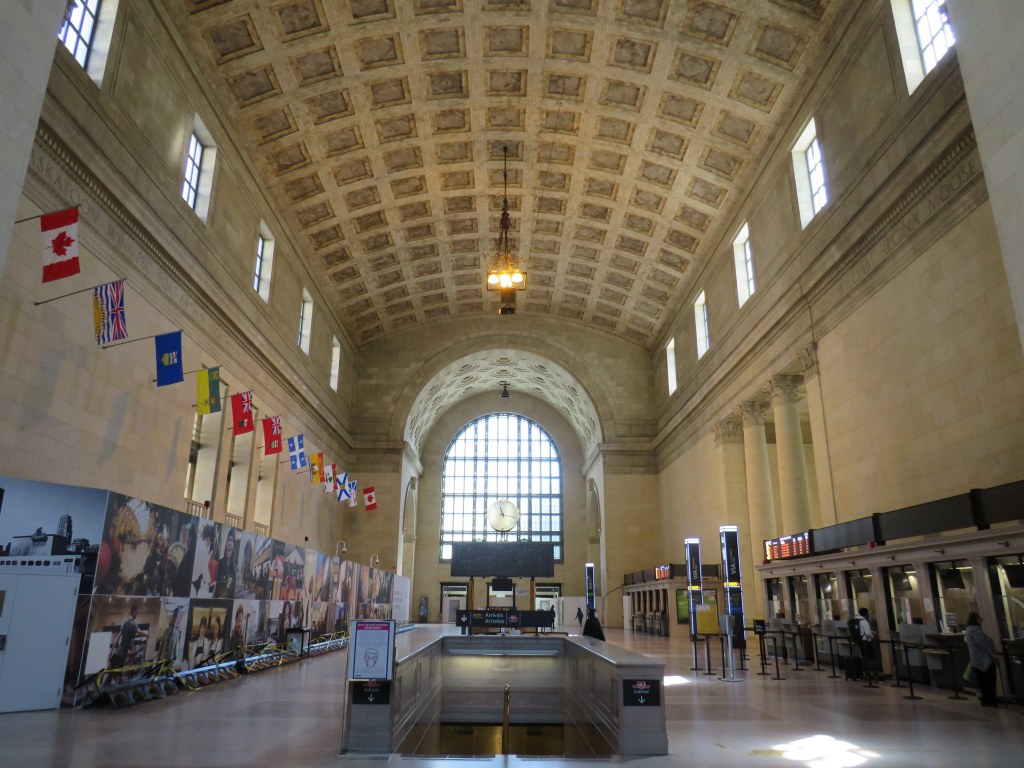
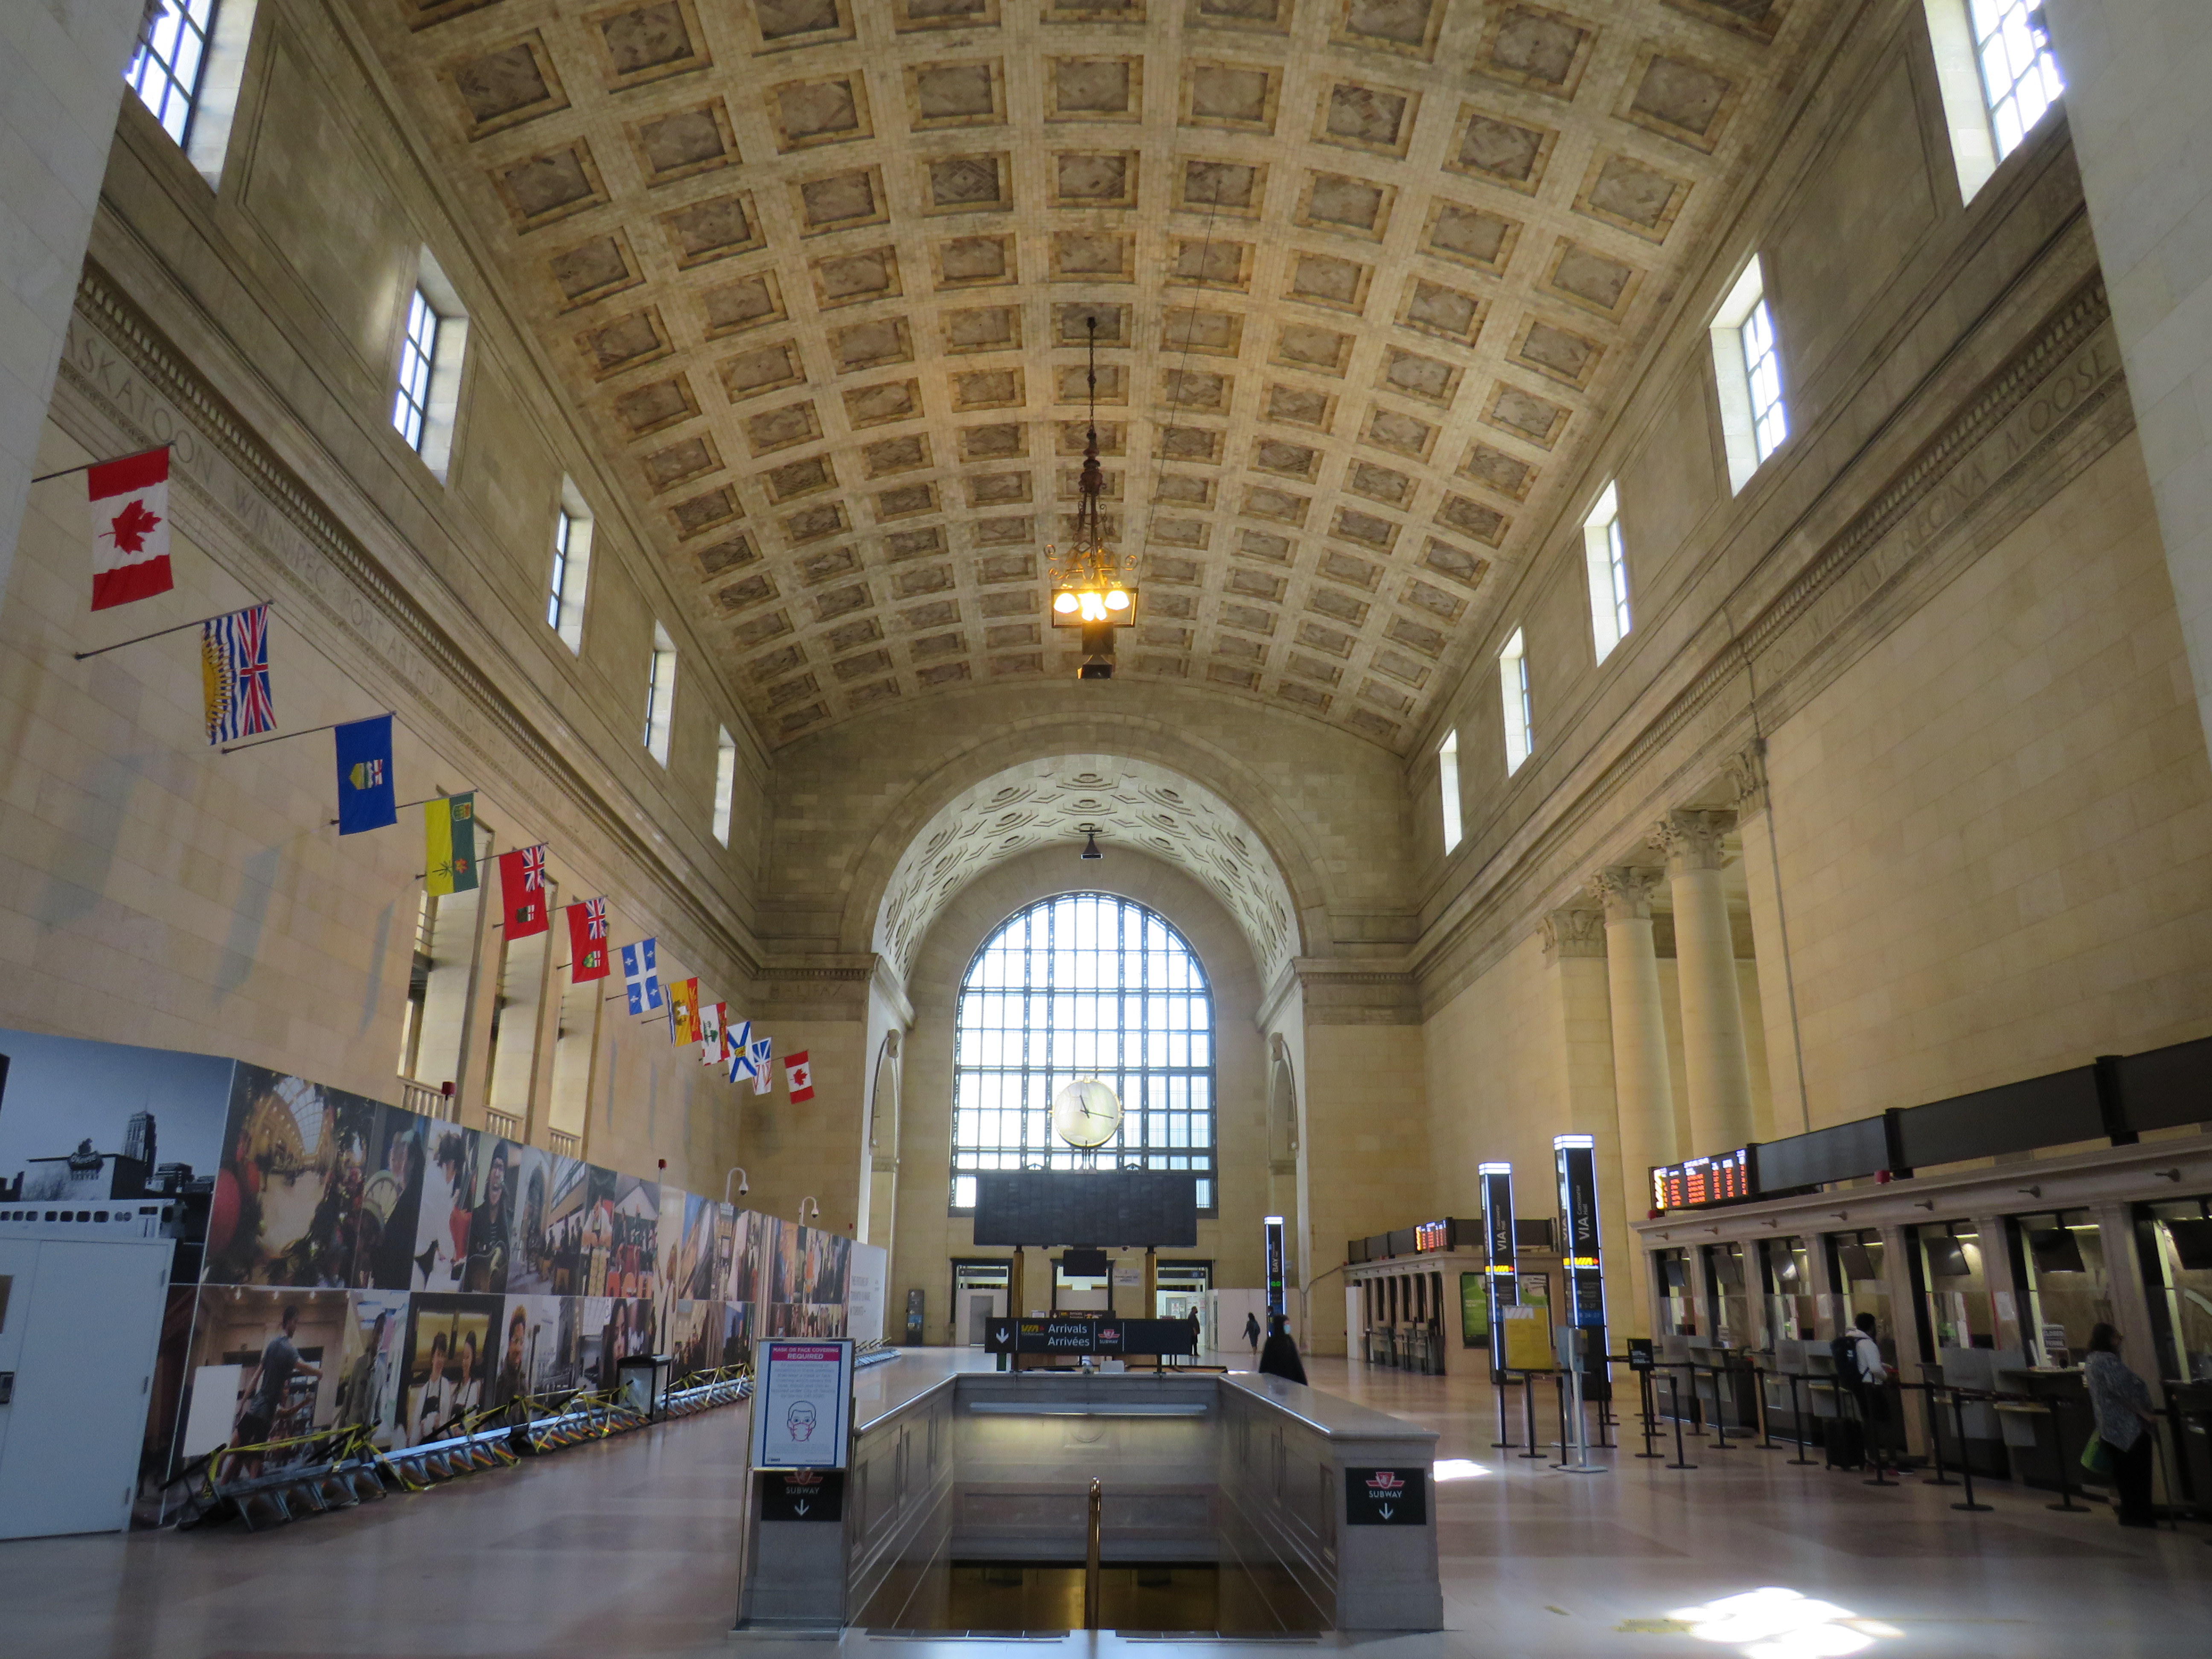
    Union Station’s Great Hall, looking east

    Union Station’s Great Hall is one of Toronto’s great indoor spaces. The station was constructed during Toronto’s first great building boom, in an era that began with E.J. Lennox’s Old City Hall (completed in 1899), and concluded with the completion of the Bank of Commerce Building, opened in 1931.

    Work on Union Station, built for the Grand Trunk Railway and Canadian Pacific Railway, began in 1914, with the grand headhouse completed in 1920, construction delayed by the First World War.

    Foreshadowing the long-delayed station renovations that are still ongoing, work on the elevated tracks and platforms connecting to the new station took nine more years, though a lavish official opening took place on August 6, 1927. By then, the Grand Trunk Railway was fully absorbed by Canadian National Railways (now CN).

    Toronto’s Union Station became Canada’s busiest and most important railway hub, with direct trains to cities throughout six provinces and six American states, with through sleeper cars to even more US destinations via Buffalo. Though Montreal was Canada’s largest city until the early 1970s, CN and CP operated out of separate terminals.

    Up high, the names of 27 Canadian cities are carved into the walls. On the north side are the names of cities that were served primarily by the Canadian National Railway (the former Grand Trunk, Grand Trunk Pacific, National Transcontinental, Canadian Northern, and Intercolonial Railways, as existed in 1914-1918); on the south, were the names of cities served primarily by the Canadian Pacific Railway.

    On the north side, from west to east, the cities read:

    Prince Rupert – Edmonton – Saskatoon – Winnipeg – Port Arthur – North Bay – Sarnia – London – Toronto – Ottawa – Sherbrooke – Levis – Moncton – Halifax

    Ottawa – Sherbrooke – Levis – Moncton – Halifax, on the northeast corner of Union Station’s Great Hall

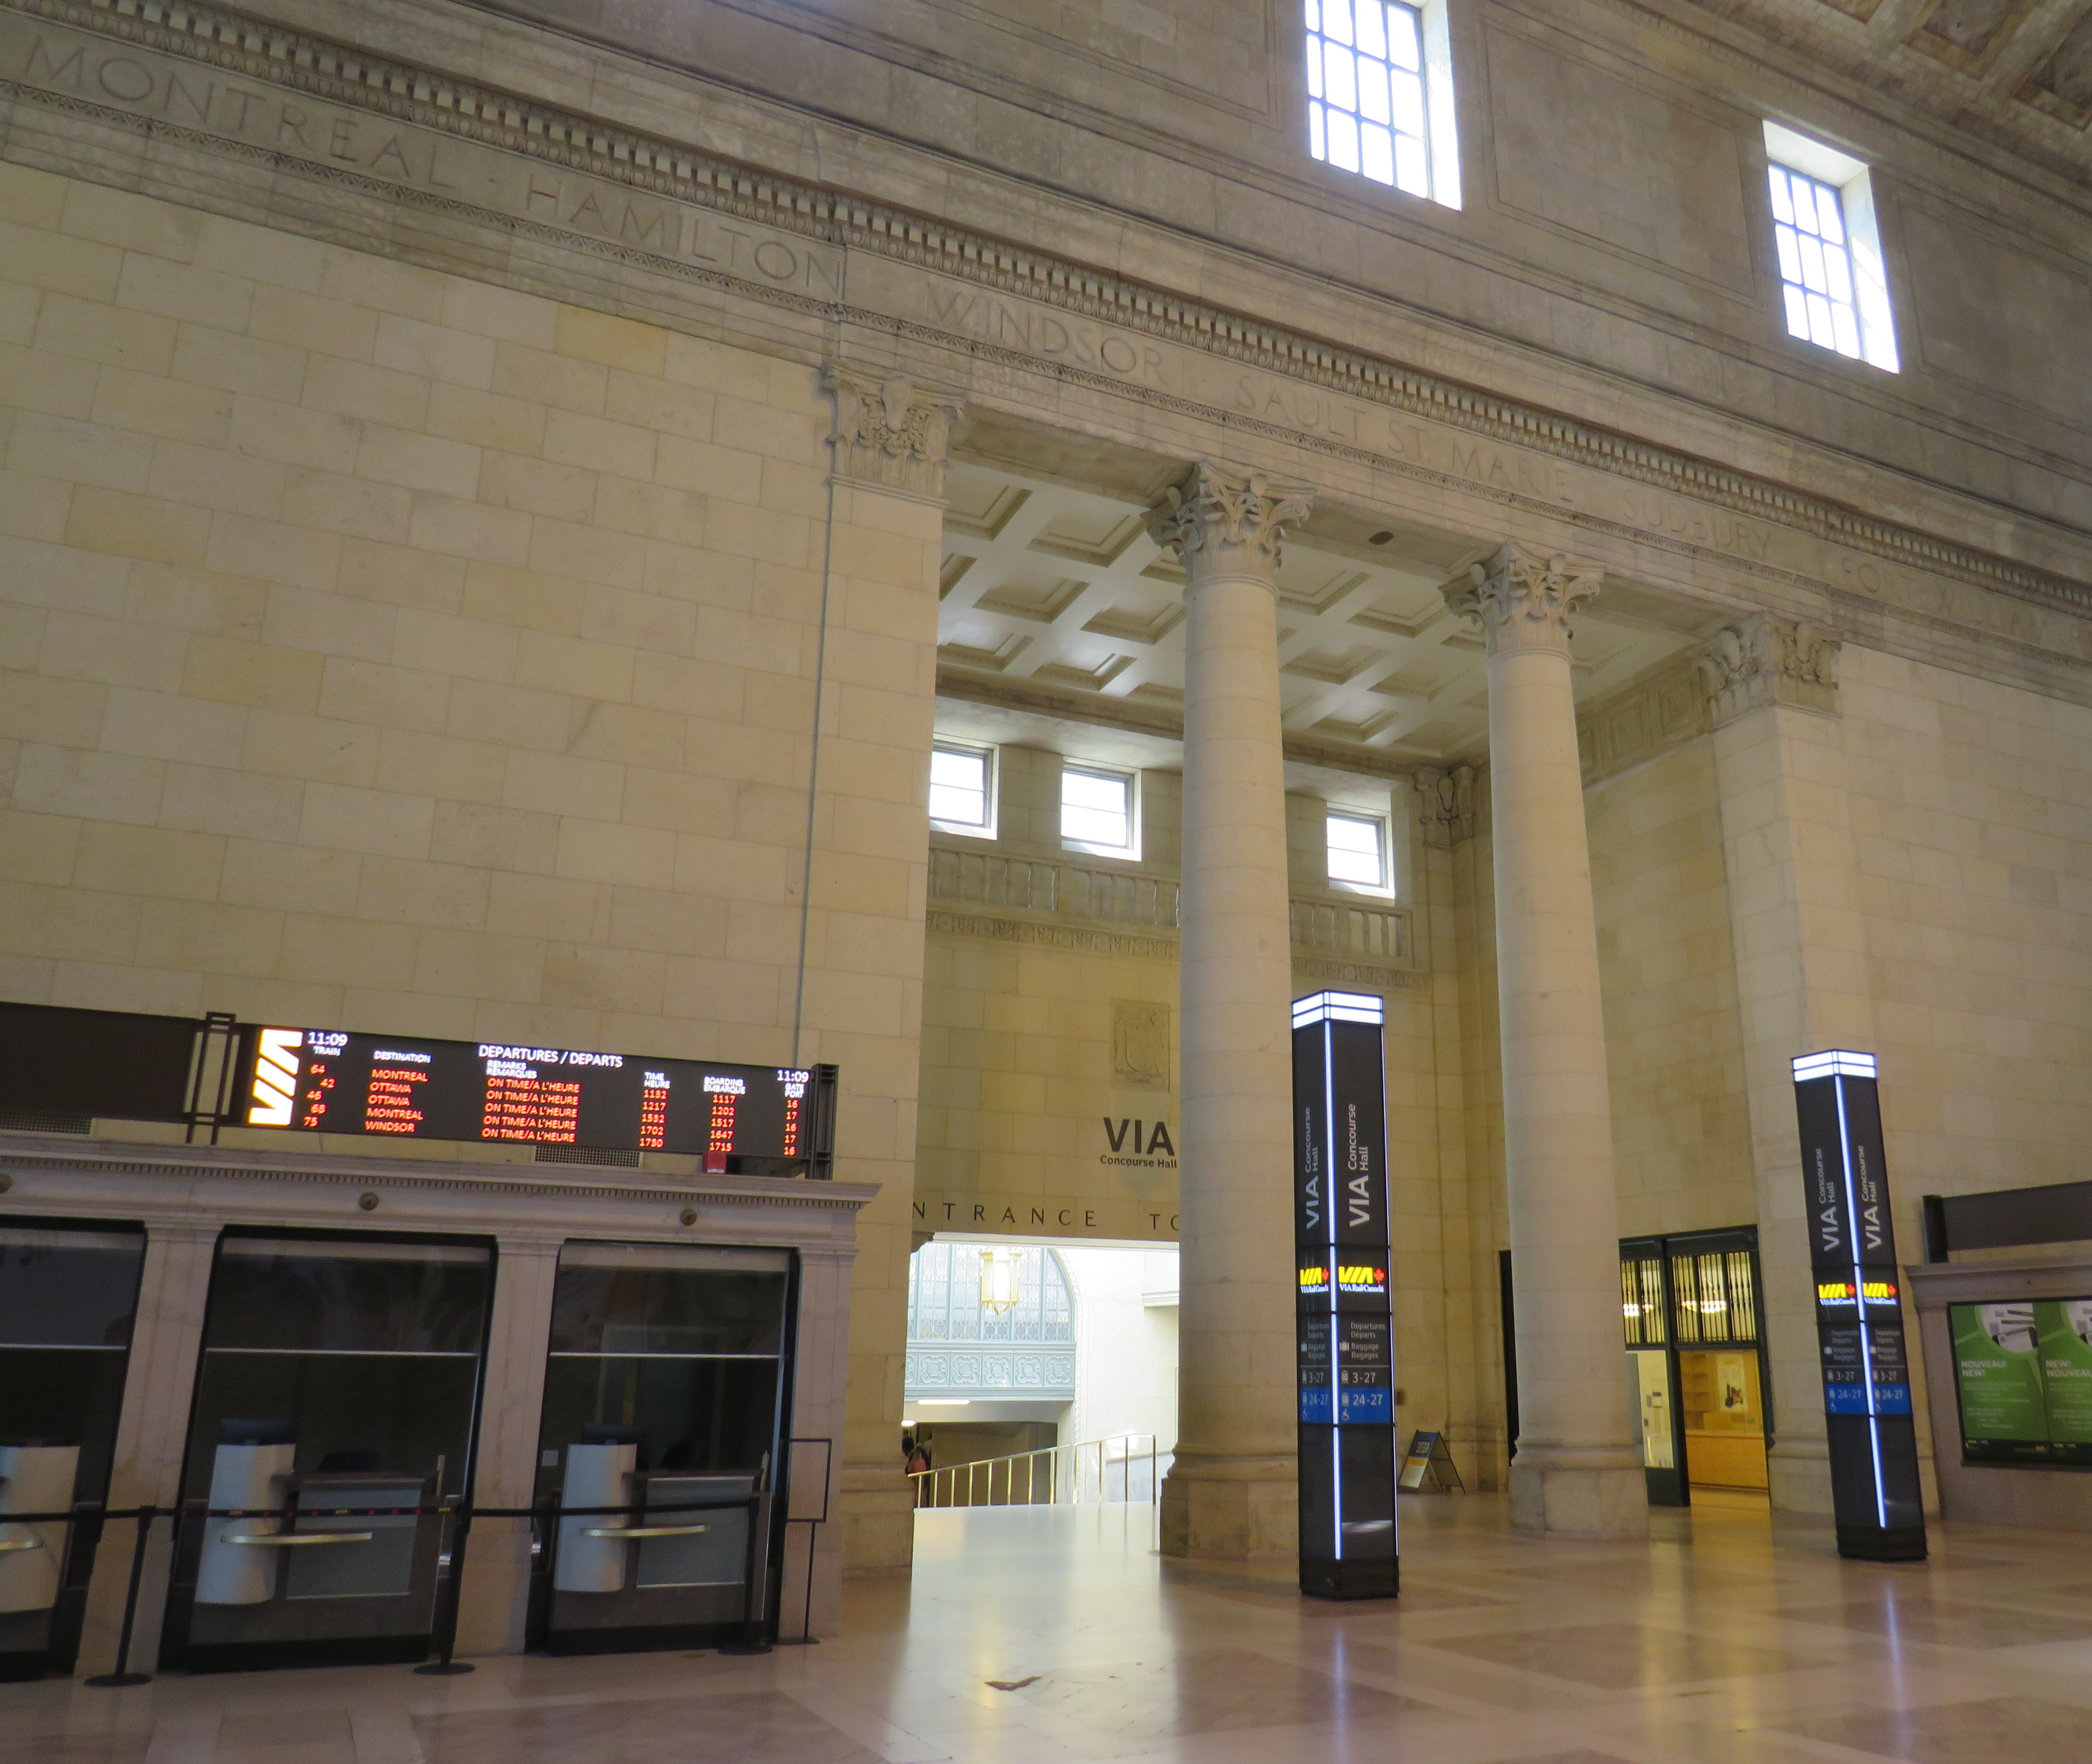
    On the south side, from east to west, the city names read:

    St. John [NB] – Fredericton – Quebec – Montreal – Hamilton – Windsor – Sault St. Marie [sic] – Sudbury – Fort William – Regina – Moose Jaw – Calgary – Vancouver

    Montreal – Hamilton – Windsor – Sault St.-Marie – Sudbury – Fort William — names of cities over the entrance to the train concourse

    Many, but not all, cities had direct train service from Union Station; the rest required a change of train at Montreal for points east, Sudbury for Sault Ste. Marie, or Jasper, Alberta, for Prince Rupert.

    As rail passenger services declined after the Second World War, the number of destinations reachable from Union Station declined. Fredericton lost its rail service in the 1960s, with buses connecting it with the CPR Montreal-Saint John train. (A VIA-operated RDC restored service between Fredericton and Saint John for a few years in the 1980s.) Sault Ste. Marie lost its RDC service to Sudbury in early 1977, though an intrepid traveler could technically still get to Sault Ste. Marie by rail until 2014, by taking a VIA train to Franz or Oba, and then waiting for many hours in remote Northern Ontario for a southbound Algoma Central Train.

    But it wasn’t until 1990, due to severe cuts made by Brian Mulroney’s PC government, that daily passenger service across the country came to an end. No longer could a rail passenger reach Calgary, Moose Jaw, Regina, or Thunder Bay (Fort William) by train. In 1994, with the rerouting of all Montreal-Halifax trains to the CN route though Lévis and Campbellton, stations in Sherbrooke and Saint John lost their remaining service. In 1998, CN abandoned its tracks through central Lévis, requiring the Ocean to be rerouted away from the ferry connection to Québec City. And in 2012, the Ontario government ordered the end to the Northlander, which ran through North Bay to Cochrane.

    Today, just 14 of the 26 destinations proclaimed on the walls of Toronto’s Union Station can be reached by train. In Fredericton, there are not even any rails remaining.

    Despite the decline in medium and long-distance passenger rail services in North America, Toronto’s Union Station is more relevant than ever. GO Transit began operating in 1967, and expanded throughout the 1970s and 1980s. Now, thanks to its role as hub for commuter and regional rail, regional and intercity buses, local transit, and the rail link to Canada’s busiest airport, Union Station became busier than ever. Today, most passengers are headed to places like Aurora, Mississauga, Pickering, or Burlington, despite the promises of far-flung destinations etched on the Great Hall’s walls.

  • Greyhound Canada’s inevitable decline leaves a few gaps to fill

    Greyhound Canada’s inevitable decline leaves a few gaps to fill

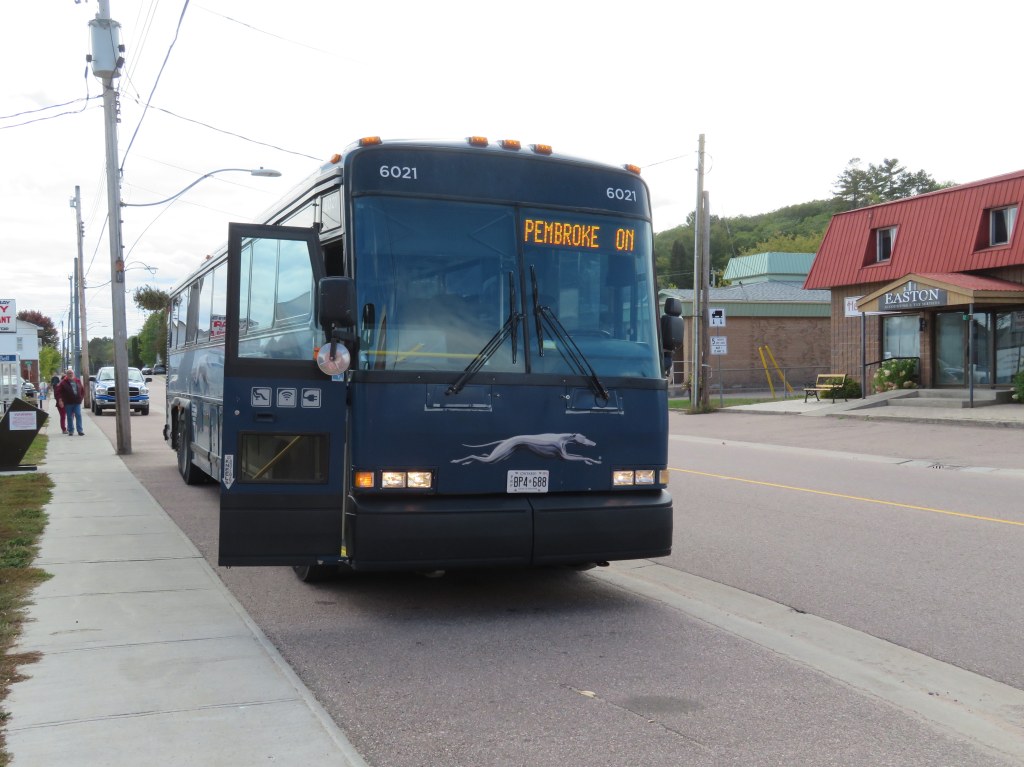
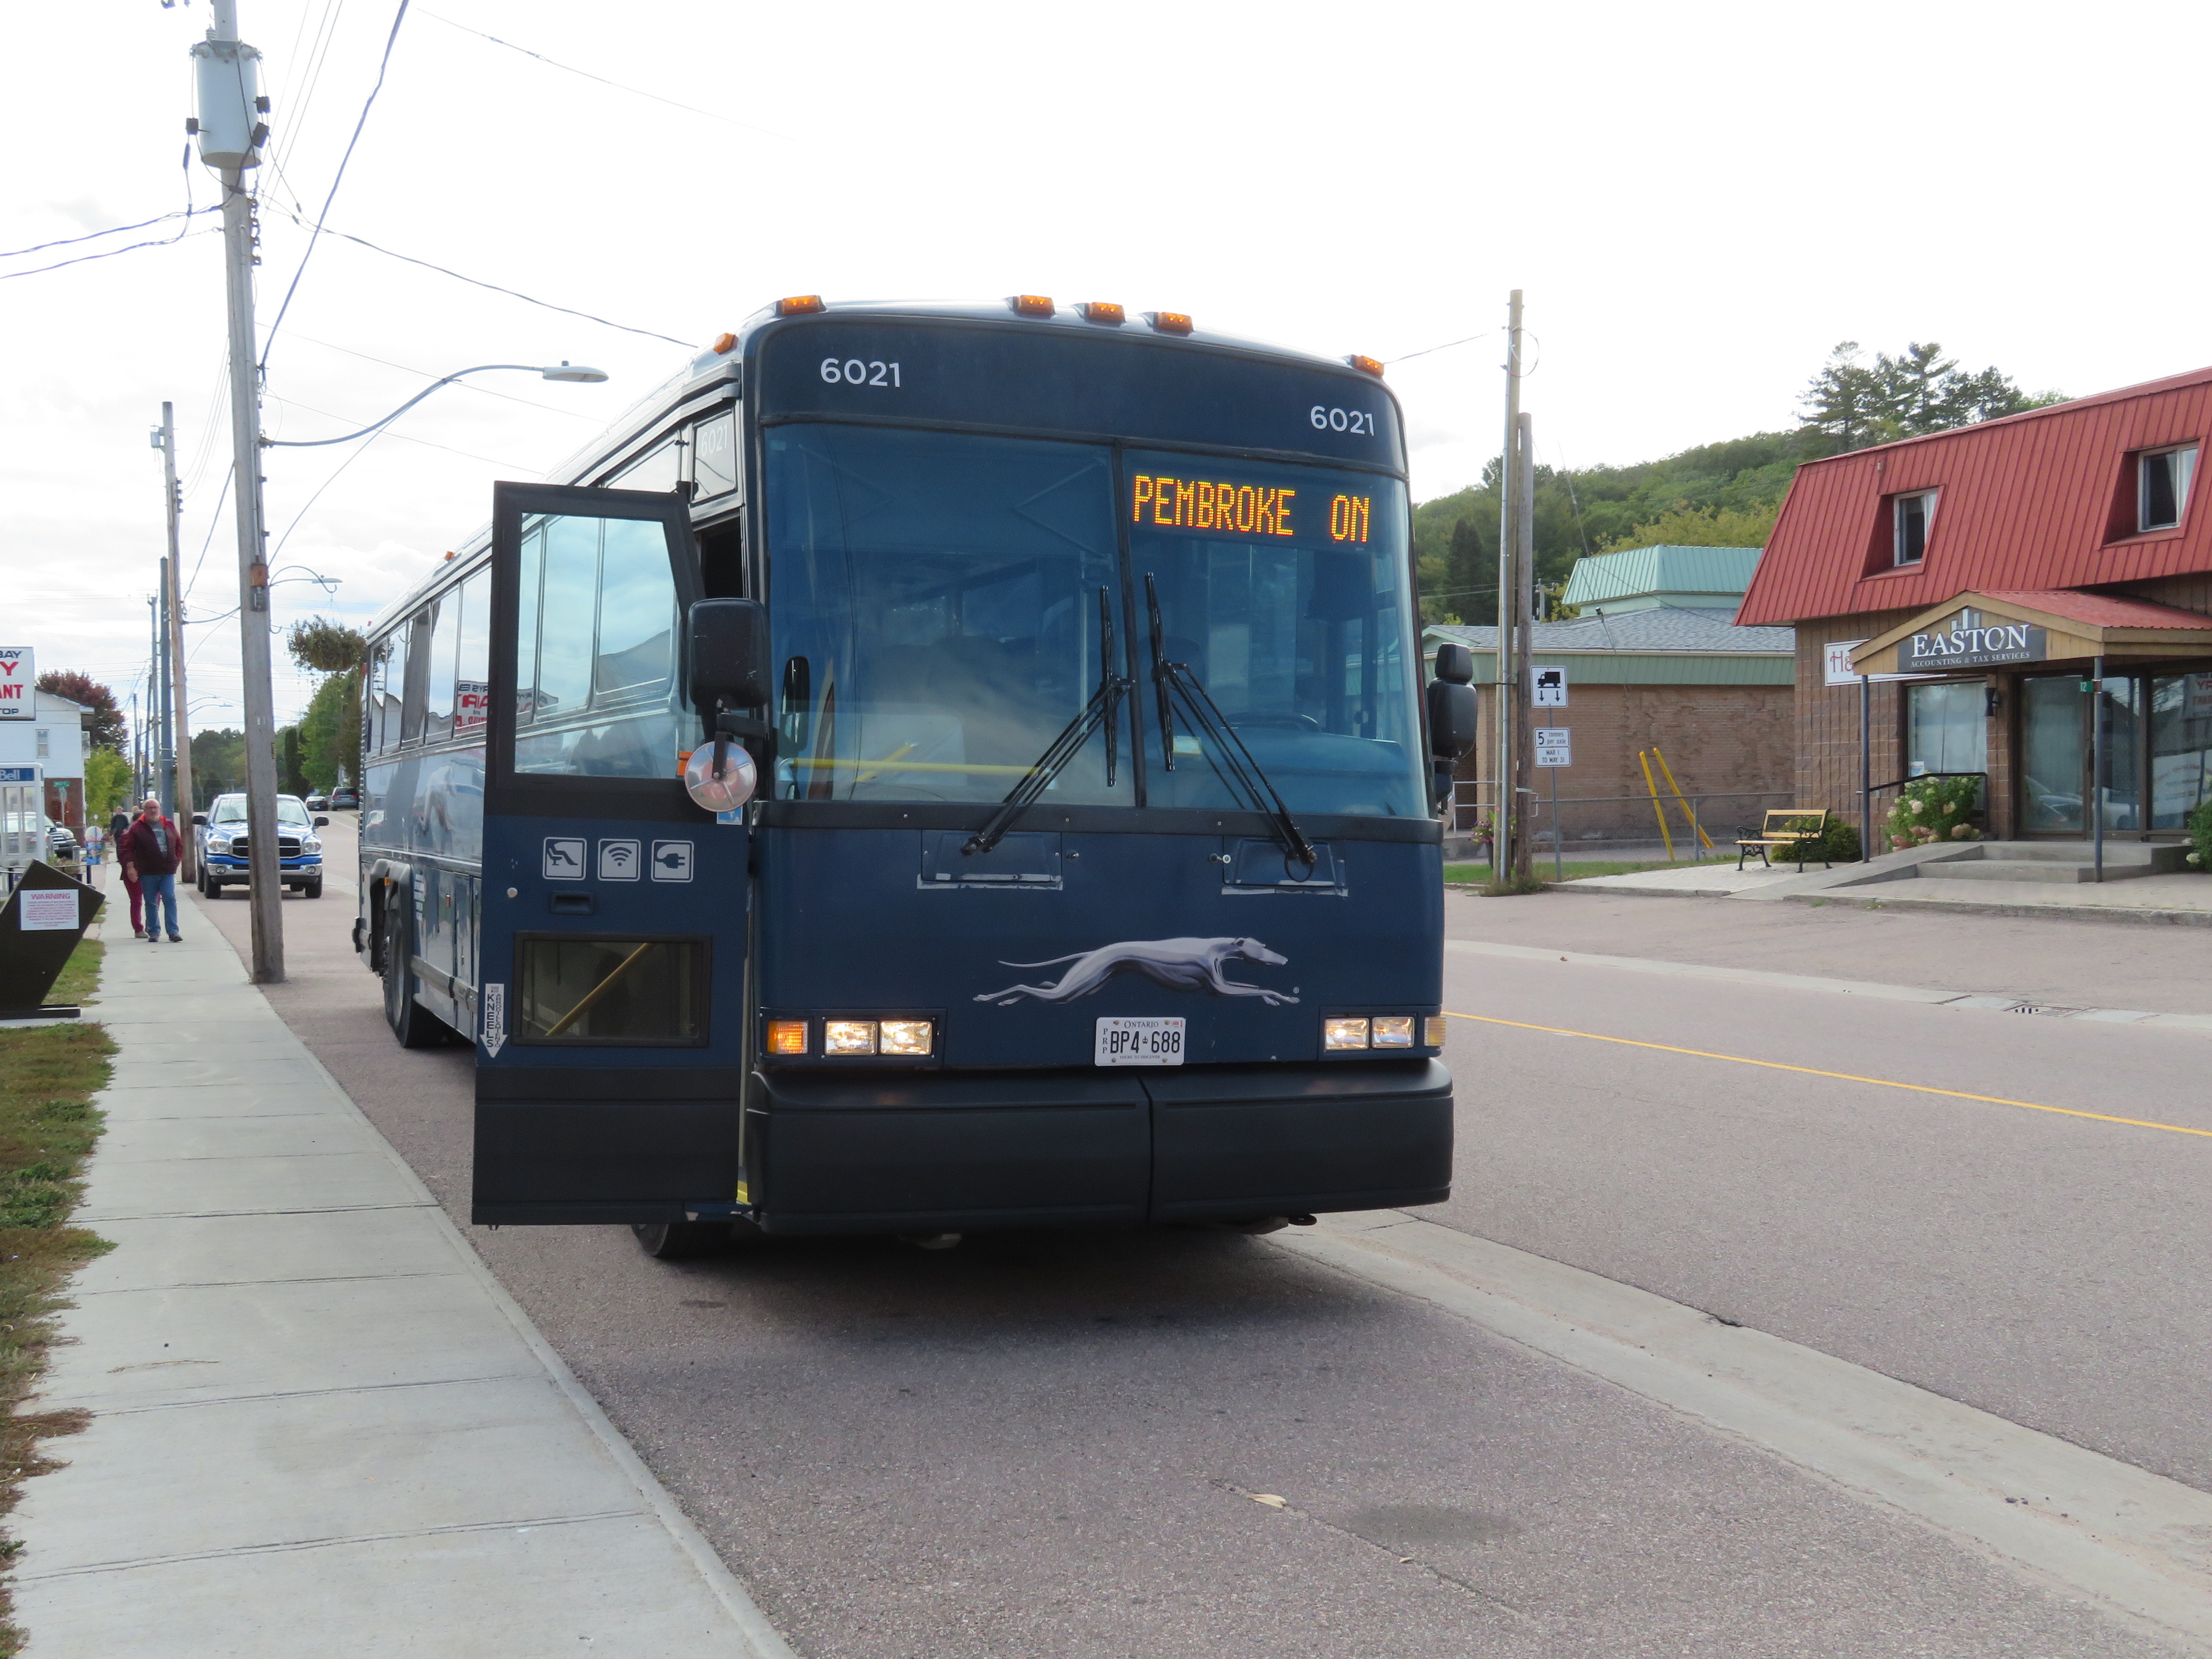
    Barry’s Bay, on Greyhound’s Peterborough-Pembroke route, is one of many smaller towns and villages that permanently lost all intercity bus connections since the COVID-19 pandemic

    On Thursday, May 13, Greyhound Canada announced that it was permanently ceasing operations. This should not have come as a shock to anyone following the intercity transport industry: for over three decades, intercity bus carriers in this country were privatized (Gray Coach and Canada Coach Lines in Ontario, shut down (Saskatchewan Transportation Corporation), or strangled by continued cutbacks and poor customer service (Greyhound). In 2018, Greyhound Canada ended all its remaining services between Vancouver and Sudbury. The loss of commuter and student traffic — Greyhound’s bread-and-butter in Ontario and Quebec — due to the pandemic led to a temporary, then permanent shutdown.

    The next day, on Friday, May 14, Megabus — operated by Coach Canada, a subsidiary of UK-based Stagecoach — announced that it would begin service on the Toronto-Ottawa and Toronto-Kingston routes abandoned by Greyhound. Two buses a day will soon operate between Toronto, Scarborough Town Centre, Kingston, and Ottawa, daily except Tuesdays and Wednesdays, terminating at St-Laurent Shopping Centre, a stop on Ottawa’s new LRT. Though this provides a new option for travelers between the big three cities (VIA Rail continues to serve this route), it does not fill the gaps left by years of decline by private intercity bus operators.

    (I updated my map of Ontario’s intermunicipal carriers to include Megabus’ new route).

    Before Greyhound’s website disappeared, I downloaded the PDF schedules for Ontario and Quebec. In 2019, Greyhound operated three routes between Toronto and Ottawa: an express bus, with stops only in Scarborough, Belleville, Peterborough, Madoc, and/or Kanata, a local bus, making stops in cities and towns along Highway 7 between Peterborough and Carleton Place, and a Kingston-Ottawa bus via Smiths Falls. You can view and download the schedules below:

    Peterborough loses two buses a day to and from Ottawa and express bus service to Downtown Toronto (which made the trip in less than two hours off-peak.) Though Peterborough is still connected to Toronto via GO Transit bus Route 88, it can take nearly three hours to go between Union Station and Downtown Peterborough, including a train connection at Oshawa, and many local stops in Clarington and along Highway 115. Other towns, such as Norwood, Marmora, Madoc, Perth, and Carleton Place, lose all bus services, except for a commuter-oriented weekday run between Ottawa and Carleton Place.

    Greyhound has chosen to become irrelevant to most Canadians long before the final shutdown announcement. Northern Ontario, at least, still has Ontario Northland (which has expanded its reach), and the Greater Toronto and Hamilton Area has GO Transit (though gaps continue to exist in that network). If your rural community is lucky, your local or regional municipality launched a new, subsidized bus or microtransit service. There is also VIA Rail, which serves most larger communities that lost Greyhound services in 2020-2021 (Windsor, Chatham, Belleville, Ottawa, etc.), though it is typically more expensive.

    Despite these continued and emerging services, there remains a need for government support of those crucial links left behind by Megabus, VIA, and GO Transit.

  • The slow decline of Canada’s passenger rail network

    The slow decline of Canada’s passenger rail network

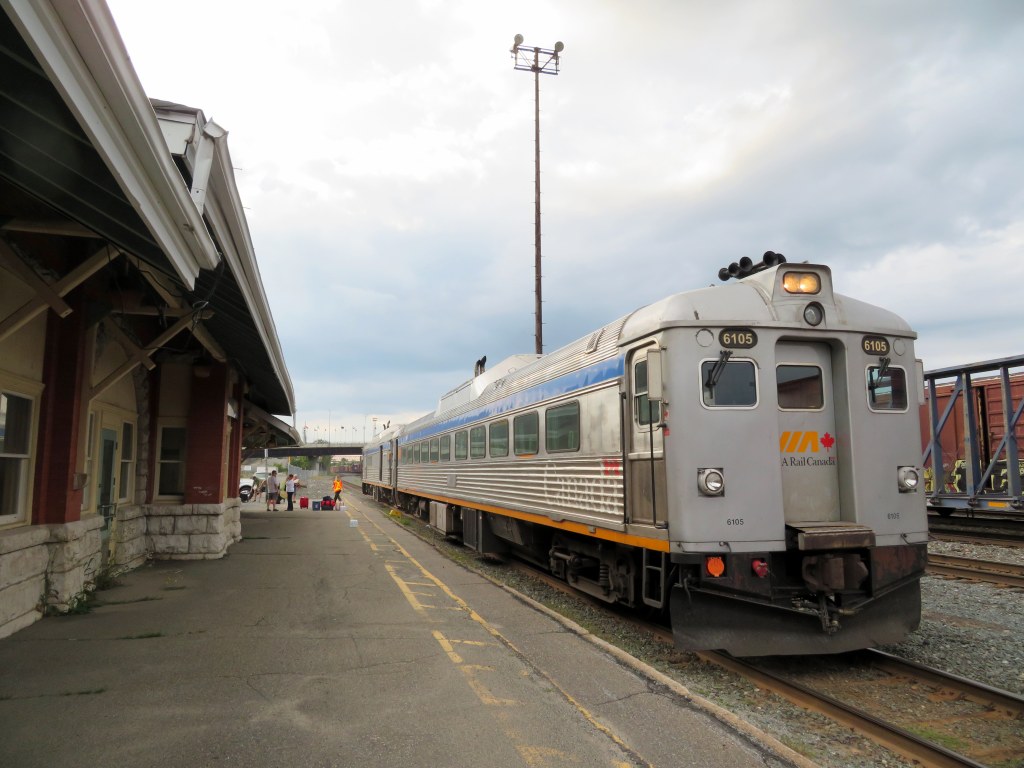
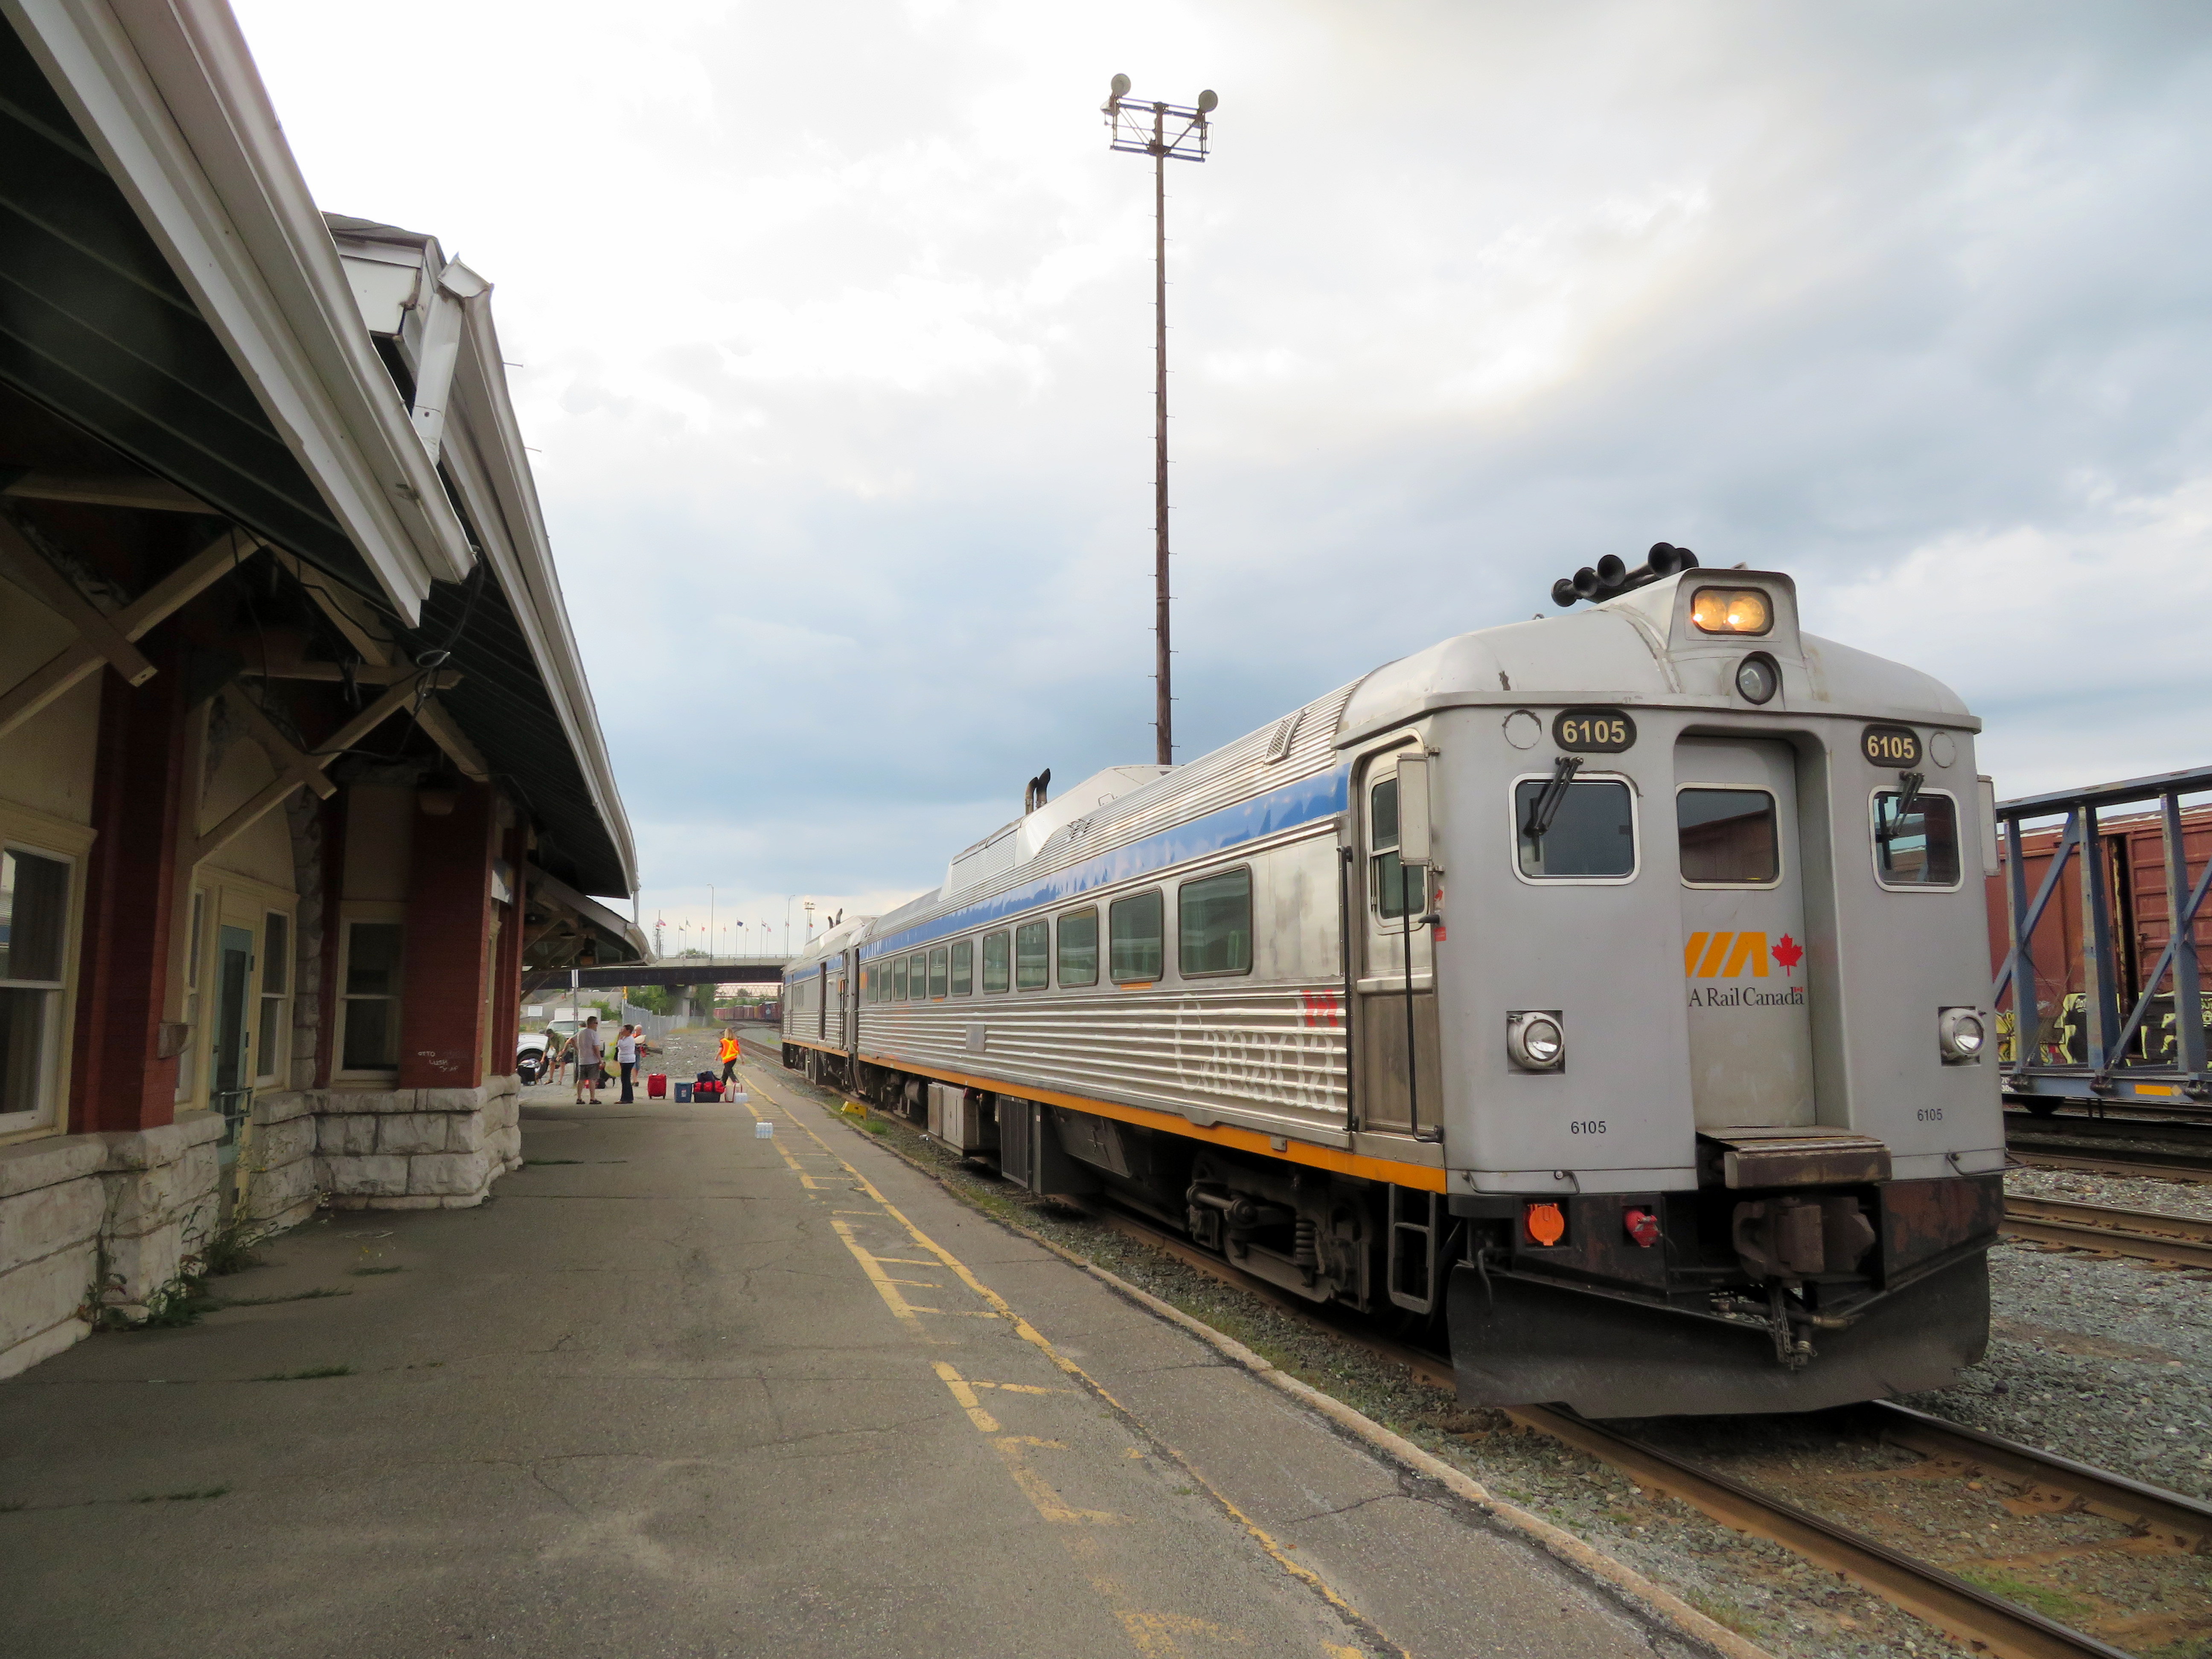
    Rail diesel coaches (RDCs), introduced to Canada’s railways in the 1950s, were used on branch lines and in local service on busy mainlines through the 1980s. Today, they can only be found on VIA’s Sudbury-White River service, a remnant of the once-mighty CPR transcontinental network.

    Updated December 18, 2023 as part of my interactive maps migration.

    I recently completed a map of all Canadian passenger rail services that operated in 1955, from Whitehorse, Yukon, to St. John’s Newfoundland. As I wrote back in March, the decline in rail services in Canada can be attributed to a few factors: passenger train revenues were augmented by express cargo and mail, mixed trains, carrying both passengers and freight, were still justified in a time before trucks took over general industrial traffic. An incomplete highway network in northern Ontario, Newfoundland, and much of Western Canada also guaranteed healthy passenger demand in an era before jet travel became accessible to the masses.

    The introduction of rail diesel coaches (RDCs), with their lower labour costs compared to conventional trains kept some branch lines going through the 1960s, but by the mid 1970s, neither Canadian National nor Canadian Pacific were interested in running passenger trains anymore; both were increasingly focused on bulk freight (grains, minerals, chemicals, finished automobiles) and intermodal container traffic.

    VIA Rail took over most of CN and CP’s passenger trains in 1978, with direct government subsidies helping to fund its operations and capital expenses. By then, passenger train service was concentrated in the highly populated Quebec City-Windsor Corridor, but there were still three trains a day between Halifax and Moncton, two trains daily between Montreal and Atlantic Canada, between Winnipeg and Vancouver, and between Calgary and Edmonton. Scheduled bus connections, some even operated by VIA Rail, provided connections to places such as St. John’s, Fredericton, Charlottetown, and the Okanagan Valley.

    Cuts imposed in 1981, 1990, and 2012 devastated the network. By 2019, there were only three trains a week in Atlantic Canada, two trains a week between Toronto and Vancouver. Even the Corridor saw cuts: there were five trains a day between Toronto, Kitchener, and Stratford, in 2019, there were just two. The only bright spots were an increase in the number of trains between Toronto and Ottawa and growing commuter rail networks in Toronto and Montreal.

    A revised map, linked to below, depicts the passenger network in 1955 and in 1980, just prior to the 1981 cuts. Routes operating between Canada and the United States are depicted (CN, CP, New York Central, Delaware & Hudson, Great Northern, Northern Pacific, and White Pass & Yukon in 1955, Amtrak and White Pass & Yukon in 1980). More information on each route is available by clicking on the lines.

    Link to interactive map depicting 1955 and 1980 passenger rail services in Canada

  • What Canadian passenger rail looked like in 1955

    What Canadian passenger rail looked like in 1955

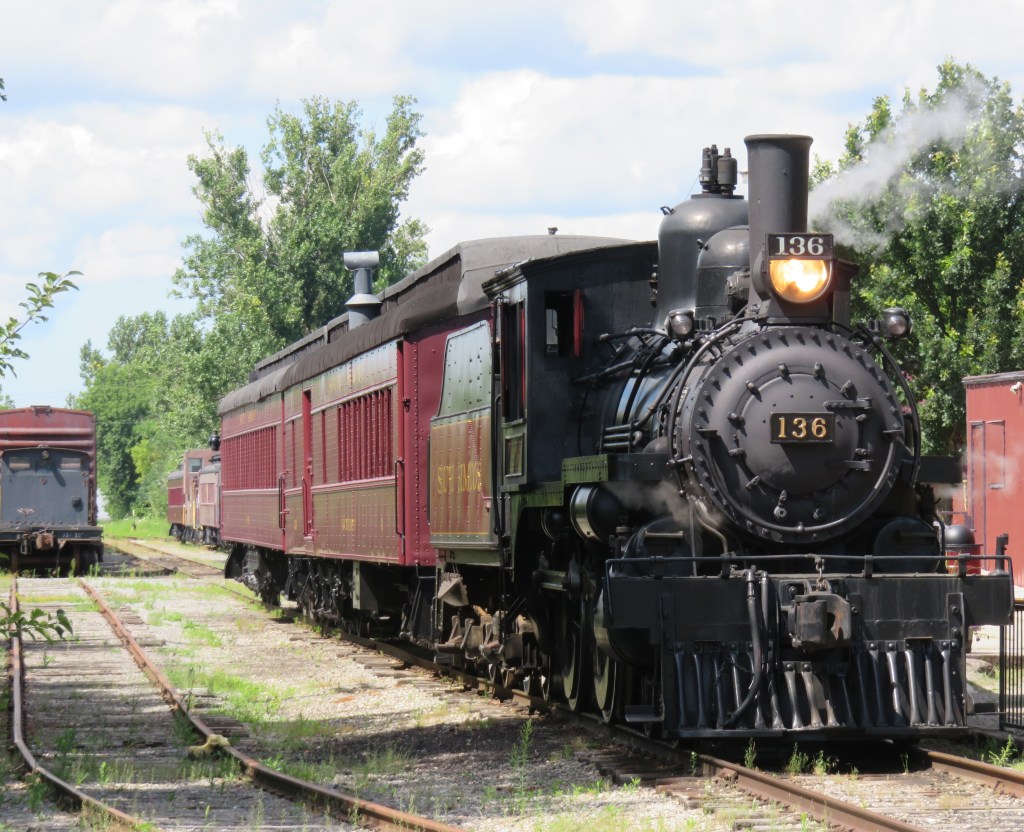
    Former Canadian Pacific locomotive #136 hauls excursion trains at the South Simcoe Railway in Tottenham, Ontario

    December 17, 2023: The complete map has been migrated to a newer ArcGIS Online account, on account of ESRI suddenly changing its monthly service account to charge bandwidth. That was a pay-as-you go account that helped me get re-acquainted with the ESRI ArcGIS Online platform before I set up a full online subscription to support a small business I co-founded in 2021.

    However, I am happy to announce that I completed updates to the Ontario Intercity Transport Map and the 1955 Canada Passenger Rail Map, and that they are safely on a new subscription server at ESRI Canada. Please let me know if you have any suggestions or corrections to the maps, especially during the migration phase.

    Link to Interactive Map

    Original post published March 25, 2021

    Sadly, passenger rail has faced a long, slow decline in Canada. Though commuter and regional rail systems in the Toronto and Montreal metropolitan areas have expanded tremendously over the last fifty years, rail service in general has declined in frequency, reliability, and even in speed. Prior to the COVID-19 pandemic, just six trains a day in each direction operated direct between Canada’s two largest cities, the fastest of those trains taking 4 hours 48 minutes to go 539 kilometres to get from Toronto to Montreal.

    Seventy years ago, 28 trains on a typical weekday called at CN’s Hamilton Station, departing for Toronto, Niagara Falls, London, Guelph, Barrie, and Simcoe, with another 12 trains calling at the TH&B station on Hunter Street. In 2019, just six GO trains departed Hamilton for Toronto each weekday, with no direct connections even to Niagara, London, or Guelph.

    There are several causes for the decline in passenger rail. In 1955, which the map below depicts, passenger train revenues were augmented by express cargo and mail, with the mail contracts alone helping to subsidize many branch lines. Lightly-travelled branch lines were served by mixed trains, which carry both passengers and freight. In Northern Ontario and Quebec, many highways were still of poor quality or unfinished — Highway 17 along the Lake Superior coast was not complete until September 1960. Construction of Highway 401 was just getting underway in 1955. In addition, the airline industry was still new, and air travel was expensive.

    Improved highways drew more passengers to coach buses, while the move to trucks for cargo and mail deliveries made many branch lines unprofitable. Larger jet aircraft made air travel cheaper and more convenient for long distances. The major railways concentrated their energies on modernizing their freight networks, with CN and CP building new freight classification and intermodal yards outside of central Toronto, while focusing on bulk freight and shipping containers.

    Though CN made efforts to win passengers back in the 1960s and early 1970s with new fare structures and equipment like the Turbo train between Toronto and Montreal, the government of Canada stepped in and took over most intercity passenger rail services in 1977. Though VIA Rail Canada acquired new modern locomotives and rail cars for the Ontario-Quebec corridor services, cuts to government subsidies made in 1981, 1989-1990, and 2012 forced further service cutbacks. British Columbia and Ontario also cut passenger services on their own rural railways.

    I mapped the year 1955 for several reasons. I have CN and CP schedules for those years in my collection, while I found contemporary Ontario Northland and New York Central schedules online. It was also the year both railways inaugurated new transcontinental trains: CP launched the Canadian, while CN launched the Super Continental, luxurious diesel-hauled trains with modern sleeping cars and lounges. There were six trains a day leaving Montreal and Toronto for Vancouver that year. In 2019, there were just two trains a week.

    In 1955, there were still many branch passenger and mixed trains in Ontario and Quebec, most of which were gone by 1965. Mixed trains were notoriously slow, though, but in many cases, there was a faster parallel highway coach. 1955 was also the last year for CP’s electric trains between Kitchener and Lake Erie, with the London & Port Stanley and Montreal & Southern Counties railways ending passenger runs a year later.

    For Ontario and Quebec, I used Paul Delamere’s amazing Ontario Railway Map Collection and Quebec Railway Map Collection, adapting his work to identify those routes used by passenger trains in 1955, then mapping them on my own server. Mapping other routes was much more labourous.

    Original version of interactive map

    Please contact me if you have any suggestions, corrections, or other feedback.

  • Passenger trains of Northern Ontario

    6876541686_61533293ef_o.jpg
    Southbound Northlander train arriving at Gravenhurst, March 2012

    In a few weeks, I will travel from Toronto to Thunder Bay by bus and by train, stopping at cities and towns like Sudbury, Chapleau, White River, Marathon, and Schreiber. I expect to write about the experience and the challenges of getting around Northern Ontario without a car. At one time, it was possible to take just one bus or train from Toronto or Ottawa to Thunder Bay. Now, the same trip can only be done in three separate segments.

    Greyhound Canada, which once ran four daily bus trips between Toronto and Winnipeg, reduced service to just two daily trips in 2009, and then to just one trip in 2015. Greyhound pulled out completely from Western and Northern Canada in October 2018, cutting all its bus routes between Whitehorse, Vancouver, and Sudbury.

    According to the joint Canadian National/Canadian Pacific railway schedule of 1976, there were daily passenger trains connecting Montreal, Ottawa, and Toronto with North Bay, Sudbury, Thunder Bay, Timmins, and Kapuskasing. There was also a daily train between Sudbury and Sault Ste. Marie, and there were trains to Fort Frances, and several trains a week through the wilderness in Algoma District.

    Most of those trains are now gone. The CP Sudbury-Sault Ste. Marie train lasted just one more year, before being eliminated in 1977. The 1990 cuts to VIA Rail resulted in the loss of the daily Canadian through Thunder Bay, Sudbury, and North Bay, and the end of direct rail service to Timmins and Kapuskasing. The Canadian, now operating on the less scenic and less-populated CN mainline, ran just three times a week, with only a shuttle service on the most remote section of the CP route between Sudbury and White River.

    21589509683_e1c3df65b0_o
    VIA Rail RDC stopped at Cartier, Ontario on its way to White River

    In 2012, the Liberal provincial government announced the elimination of the Northlander, a daily train operated by Ontario Northland between Toronto, North Bay, and Cochrane. This decision was made with the intention of “modernizing” Ontario Northland, the provincial Crown corporation that operates freight and passenger rail and coach buses in northeastern Ontario. In 2014, the federal Conservative government cancelled the subsidy to run thrice-weekly Algoma Central Railway’s passenger train between Sault Ste. Marie and Hearst. (A popular excursion train still operates to Agawa Canyon.)

    Though I was too young to travel on my own when the devastating 1990 VIA Rail cuts were made, I was able ride the Northlander and the Algoma Central Railway passenger trains while they were still operating.

    With a friend from Calgary, I rode the Northlander from to Toronto to Cochrane and back, in May 2012. We continued to Moosonee near the shores of James Bay coast on the Polar Bear Express, which continues to operate. I made a second trip on the Northlander from Cochrane to Toronto in September 2012.

    Ontario Northland continues to operate a freight railway, scheduled coach buses, and the Polar Bear Express, a mixed train between Cochrane and Moosonee. There are no all-season roads to Moosonee, so the train remains a lifeline for the James Bay community. We also took that train in May 2012.

    In February 2014, after learning that Canadian National (owner of Algoma Central) was planning on discontinuing the local ACR passenger service, a friend and I made the trip to Sault Ste. Marie to ride the train all the way to Hearst and back. It was an especially memorable ride because of the deep snow, as well as the opportunity to take photographs from the vestibules between the rail cars. We traveled with a group of snowmobilers from Wisconsin (their Ski-Doos were in a baggage car) as well as local residents heading to their cabins.