 How each of Toronto’s 25 wards voted for mayor
November 8, 2018: I updated this post to look at the results for fourth place mayoral candidate Saron Gebresellassi.
I started this website four years ago after I began producing maps of the local council races and ward-level results of the 2014 municipal election and sharing them on Twitter. I figured that I would continue to map the results after the 2018 election. In this post, I start with the mayoral race results. Over the next two months, I will dive into the local council races as poll level data and poll boundary shapefiles are now available on the City of Toronto’s Open Data catalogue.
John Tory’s landslide win this year was no surprise. Despite urban progressives’ frustration with his centre-right agenda, Tory has remained popular with a large segment of Toronto’s population. Until July of this year, there were no high profile challengers to Tory. Meanwhile the mayor assembled a campaign team that included Nick Kouvalis and Warren Kinsella, and had months to fund-raise a massive election war chest.
Former Toronto chief planner Jennifer Keesmaat registered on July 27, 2018, the last day of nominations for mayor. Keesmaat decided to run for mayor after Tory delivered an inadequate response to Premier Doug Ford’s Bill 5 in July 2018, in which he called for a referendum rather than forcefully opposing Ford’s surprising and vindictive attack on Toronto City Council.
Keesmaat did not have the time, organization, and money to make a strong campaign against Tory. Her platform was more progressive than Tory’s but still not distinctive or bold enough. Keesmaat even promised to keep property tax increases at or below the level of inflation, Tory’s key plank.
It was no surprise that Tory was able to win with 63 percent of the vote, coming in first in all 25 wards, and 1599 of 1700 regular election day polls. Tory placed first in every poll won by Doug Ford in 2014.
Keesmaat placed first in only 101 polls, with all except one of those being in the old City of Toronto (the other poll was York University).
 Poll-by-poll results for the 2018 mayoral race
Interestingly, but not too surprisingly, the polls in which Keesmaat placed first were very similar to those polls where Olivia Chow did best in 2014 — established west Downtown neighbourhoods such as the Annex, Little Italy-Palmerston, Seaton Village, the Junction, and Parkdale. Had the old 44 wards still been in use, Keesmaat would have placed first in three wards — old Wards 14, 18, and 19, the same as Chow’s results in 2014. These neighbourhoods are clearly the urban progressive base.
Tory finished first in central and east downtown neighbourhoods, including the areas with younger, more diverse populations such as City Place, the Entertainment District, and Liberty Village. It’s also quite clear that Keesmaat failed to capture the imagination of large segments of Toronto’s population — especially in areas with large populations of immigrants and visible minorities. Any left-leaning challenger needs to win over not only the suburbs, but also downtown condo dwellers.


Maps of the mayoral race results at the ward level, with the old 2014 ward boundaries
Coming in third place in the 2018 mayoral election was white supremacist Faith Goldy, who managed to win over 25,000 votes, or 3.4 percent of all votes cast. Goldy fared poorly in most polls, and she failed to win more than 20 percent of the vote in any of those polls. But still, she was able to get over 10 percent of the votes in 16 polls across Toronto. They are mapped below. Goldy’s support was highest in the suburbs, especially central Etobicoke and in the Bathurst-Sheppard area, and in north Scarborough.
 Most of those polls where Goldy got relatively high percentages of the vote had few total ballots cast. Poll 68 in Ward 17, a condo building near Leslie Street and Sheppard Avenue, had the highest vote percentage for Goldy, though this was only 7 of 35 total votes for mayor. Poll 1 in Ward 19 had the highest absolute number of Faith Goldy supporters (excluding advance polls), with 86 out of 1030 mayoral votes cast.
Still, it saddens me to see a xenophobic, racist fringe candidate get as much support as she did in Toronto, a city whose motto is “diversity our strength.”
After I wrote this blog entry on Wednesday, Brittany Andrew-Amofah on Twitter suggested that I take a look at the results for fourth place candidate Saron Gebresellassi. Gebresellassi’s platform was stronger than Keesmaat’s, focusing on housing, transit, mental health supports, and opportunities for youth and racialized communities, especially in Toronto’s inner suburbs. Gebresellassi argued strongly for these issues at mayoral debates.
Unfortunately, Gebresellassi only got 2 percent of the city-wide vote. She fared better in eight wards in central Toronto, as well as in York South-Weston, Humber River-Black Creek and Scarborough Southwest. Perhaps not coincidentally, these eleven wards were also the provincial ridings won by the NDP in the June provincial election. Gebresellassi’s highest support was in Ward 9 – Davenport, where she got 5.2% of all votes cast. Ward 9 is also where Keesmaat had the highest support, nearly beating Tory.
 Ward-level results for Saron Gebresellassi
Gebresellassi took more than 10 percent of the vote in 17 polls. Many of these polls were located in Toronto Community Housing (TCH) buildings, co-ops, and shelters. Twenty-four percent of all voters in Poll 22 in Ward 13, located at a TCH property in St. Jamestown, chose Gebresellassi.
Saron Gebresellassi spoke passionately about the right for safe and affordable housing, and many voters, especially those living in social housing took notice.
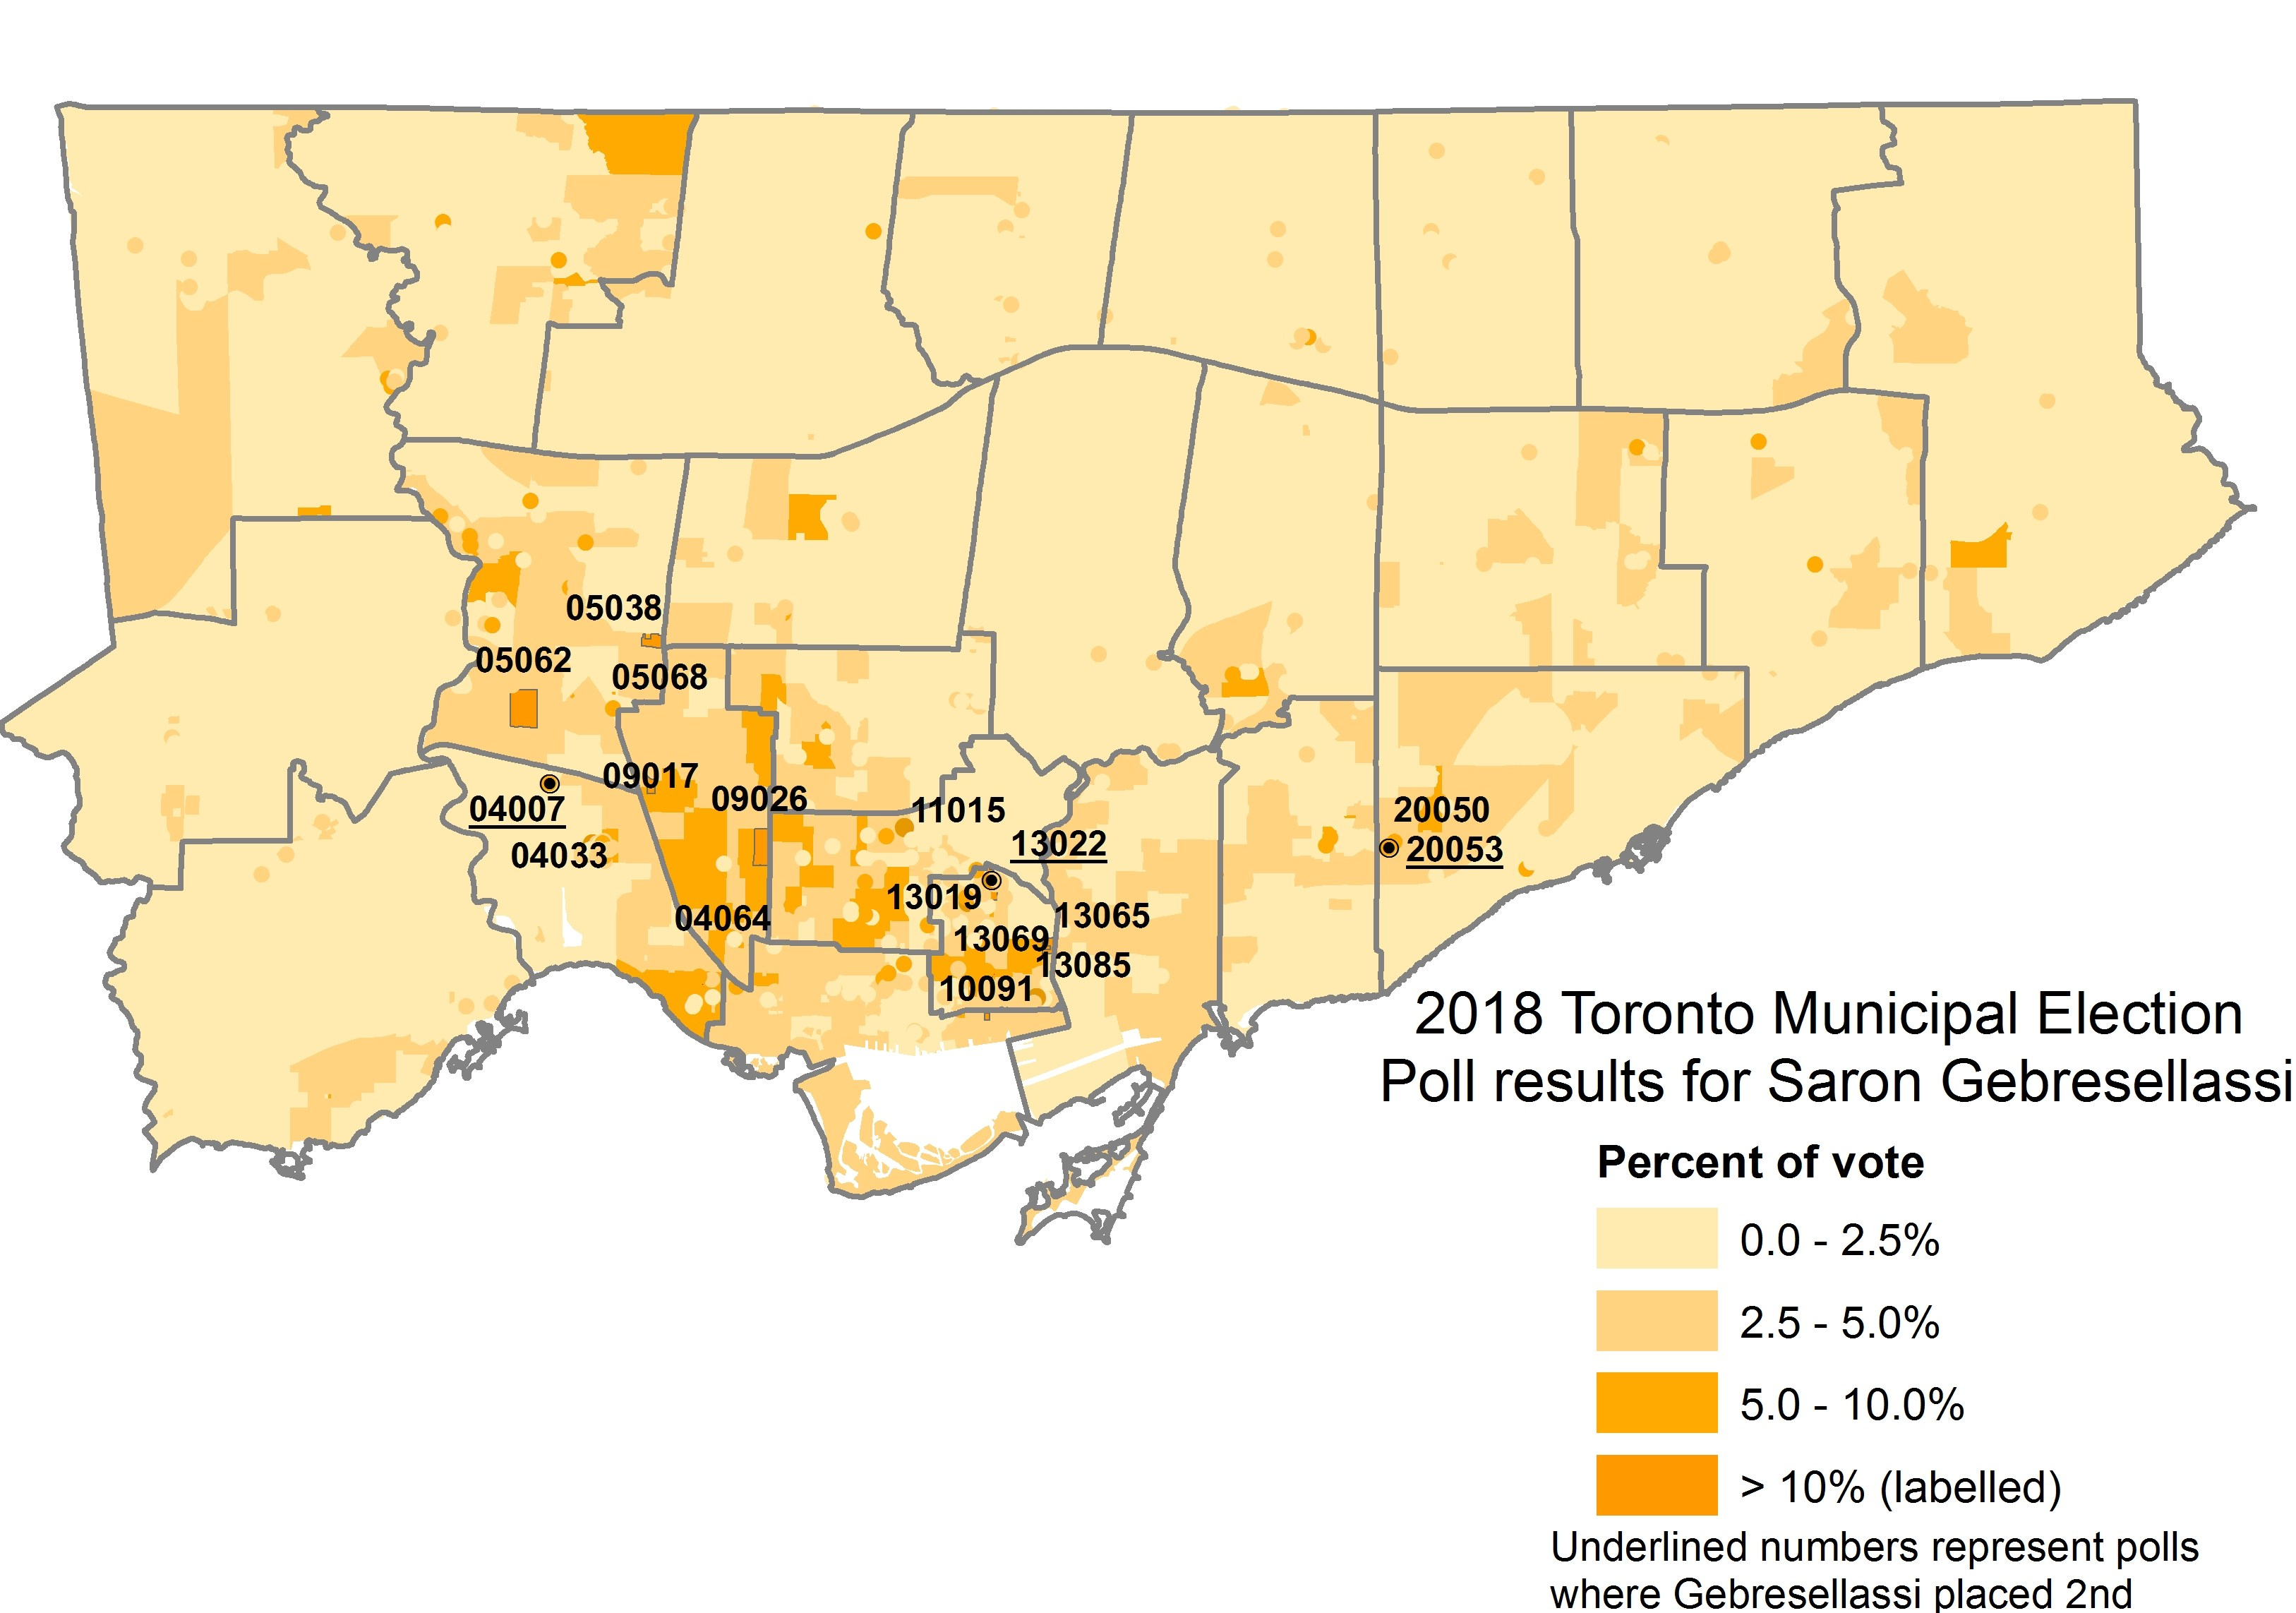
Poll-level results for Saron Gebresellassi. Polls in which Saron Gebresellassi got more than 10 percent of the vote are labelled; the three polls where she placed second (to John Tory) are underlined.
As I mentioned before, I plan to take a close look at the council races over the next little while. Despite a frustrating and at times dispiriting municipal election here in Toronto, it’s worthwhile, I think, to look back at what happened. How did some incumbent councillors win, while others lost? How did the new boundaries change local dynamics?

Leave a comment