Category: Maps

  • Mapping the council race in Ward 8, Eglinton-Lawrence

    Ward 8, Eglinton-Lawrence, was one of only two Toronto city council races in which an incumbent councillor was defeated by a non-incumbent challenger (the other being Ward 25). In the 2018 municipal election, Mike Colle defeated Christin Carmichael Greb and eight other candidates. It wasn’t a surprising win, given the name recognition Mike Colle, and his son, Josh Colle, have in the ward, but the dynamics were interesting, if not a bit discouraging.

    Ward 8, Eglinton-Lawrence, encompasses three former ward boundaries: the entirety of old Ward 16, represented by Councillor Carmichael Greb, most of old Ward 15, represented by centrist and TTC chair Josh Colle, and a small portion of old Ward 21, represented by Joe Mihevc.

    In 2014, Carmichael Greb won with only 17.4 percent of the vote in old Ward 16, whose boundaries were between Yonge and Bathurst Streets, north to Highway 401 and south to Eglinton Avenue. In a race featuring 16 candidates, Carmichael Greb was helped by her conservative credentials (she is the daughter of former Conservative MP John Carmichael) and by John Tory’s endorsement and robocalls. She registered to run again in 2018, first under the approved 47-ward model, then in the new 25-ward model imposed by the province. Dyanoosh Youssefi, who came in third in 2014, also registered. Other challengers included Jennifer Arp, a TDSB trustee, and Beth Levy, a teacher and assistant to local Liberal MP Marco Mendicino.

    With several strong challengers against her, it looked likely that Councillor Carmichael Greb, who didn’t have a reputation as a responsive or hard-working representative, would be re-elected in the new 47-ward model.

    Josh Colle was also seeking re-election under the 47-ward model in the new Ward 13, which extended west from Bathurst Street west to the GO Transit Barrie Line. In 2014, Colle won re-election with 75.2 percent of the vote. In 2018, Colle’s most prominent challenger in Ward 13 was going to be Rocco Achampong. Achampong, a Conservative and a respected lawyer, ran for mayor in 2010.

    But just two days before nominations were set to close, on Wednesday, July 25, Josh Colle suddenly announced that he was retiring from municipal politics, instead looking to work in the private sector. His father, 73-year old Mike Colle, would run instead. The elder Colle was Liberal MPP for Eglinton-Lawrence from 1995 through 2018, when he was defeated by the Ontario PCs. Before 1995, Colle was a North York and Metro councillor. The sudden, last minute father-son swap was a surprising and a rather cynical move. But that wasn’t the only shock that week.

    On Friday July 27, the same day as deadline for council nominations, the provincial government announced Bill 5, reducing the number of Toronto city councillors from the approved 47 to just 25. Achampong was one of the first to challenge Bill 5 in court, but unfortunately, he and the other applicants were not successful. Achampong and six other candidates who signed up under the 47-ward council chose not to run in the new Ward 8 and withdrew their nominations.

    Poll-level results of the municipal election for Ward 8

    Unsurprisingly, Mike Colle won, with 41.3 percent of the vote. He had the advantage of name recognition as the former MPP for Eglinton-Lawrence, as well as his son’s record as councillor for the western half of the new ward. Christin Carmichael Greb ran into controversy during the final days of the campaign, declaring herself the “John Tory candidate” despite not netting an endorsement in 2018. Despite coming in a distant second, she increased her vote share from 2014, netting 21.7 percent of all ballots cast in Ward 8.

    Had the 47-ward model prevailed, it’s quite likely Carmichael Greb would have won despite her unimpressive first term. Incumbency and name recognition form a huge advantage in municipal elections, especially without political parties or ranked ballots. But Mike Colle was able to get the most votes even in old Ward 16 — 31.7 percent to Carmichael Greb’s 25.6 percent.

    Mike Colle’s win is unique to Toronto municipal politics. There are many current or past city councillors who followed their parents on city council — including Mike Layton, Joe Cressy, and Stephen Holyday, who were re-elected in 2018 — but Mike Colle might be the first to follow in his son’s footsteps.

    Ward 8 Eglinton-Lawrence
    Candidate Total votes Percentage
    Jennifer Arp 2404 7.1
    Christin Carmichael Greb 7395 21.7
    Mike Colle 14094 41.3
    Darren Dunlop 210 0.6
    Lauralyn Johnston 992 2.9
    Beth Levy 3122 9.2
    Randall Pancer 134 0.4
    Josh Pede 420 1.2
    Peter Tijiri 72 0.2
    Dyanoosh Youssefi 5253 15.4


  • Mapping the council race in Ward 19, Beaches-East York

    Ward 19 Beaches-East York was one of the closest races in Toronto’s 2018 municipal election. It was only one of two “open” wards out of 25 — meaning no incumbent councillor was seeking re-election.

    Earlier this year, Councillor Janet Davis (old Ward 31) and Mary-Margaret McMahon (old Ward 32) announced that they were not running again for Council. Davis, a prominent member of council’s left wing, endorsed Diane Dyson, a community activist, as a candidate for Ward 35, which had similar boundaries to Davis’ ward. There were ten other candidates, including David Del Grande, a product manager and former provincial Green Party candidate, and musician Brenda MacDonald, who ran against Davis in the last two elections.

    Meanwhile McMahon, a centrist, endorsed Brad Bradford, a city staffer who worked for the office of the Chief Planner at City Hall. There were eleven candidates running in Ward 37 (mostly congruent with old Ward 32), including Matthew Kellway, the former NDP MP for Beaches-East York, Joshua Makuch, a management consultant and a Canadian Forces veteran who served in Afghanistan, and Valérie Maltais, an environmental scientist.

    Like so many races across the city, Doug Ford’s Bill 5 changed the dynamics completely. The two wards were merged into Ward 19. Five candidates withdrew from the tougher race, but there were still 16 candidates having to run in a much larger area than they planned for.

    Councillor Janet Davis switched her allegiance from Diane Dyson to fellow New Democrat Matthew Kellway. Brad Bradford was endorsed by both Jennifer Keesmaat, his former boss, and John Tory, who likely wanted a more centrist councillor in Ward 19 than Kellway. It became a two-way race, with Tory and McMahon campaigning hard for Bradford, with Kellway having the support of Davis and fellow NDP politicians and activists. Kellway had the support of the Toronto Star’s editorial board, while Bradford had the endorsement of the Toronto Sun.

    In the end, Brad Bradford won with 38.6 percent of the vote, while Kellway took 37.8 percent, with a difference of just 288 votes. Joshua Makuch came in a distant third, with 6.2 percent of the vote, and Diane Dyson placed fourth.

    Kellway came in first place in the advance polls. But on election day, Bradford placed first in 33 polls, while Kellway placed first in 28 polls. Brenda MacDonald came first in Poll 45. Only five votes were cast in Poll 20, which was a five-way tie.

    2018 Election - W19

    Kellway’s best results were north of Danforth Avenue, especially in the east, along Lumsden Avenue and Dawes Road. This area encompasses several Toronto Community Housing buildings and the lower-income Crescent Town neighbourhood. The support and organization from outgoing councillor Janet Davis probably helped, as did Kellway’s record as NDP MP. Had Toronto stayed with the 47 wards, it’s very likely that Diane Dyson would won in Ward 35, given Davis’ previous endorsement. Either way, the support of Mary Margaret McMahon and John Tory would have seen Brad Bradford win in Ward 37. Tory now has a new ally on council.

    The south half of Ward 19 is more affluent and less diverse than the area north of Danforth Avenue. Old Ward 31, north of Danforth Avenue and represented by Davis, had a 2016 median household income of $61,575. Old Ward 32, south of Danforth Avenue and represented by McMahon, had a 2016 median household income of $84,445. In the north half, 42.1 percent of the population identifies as a visible minority, compared to 24.3 south of The Danforth.

    Ward 19 Beaches-East York
    Candidate Total votes Percentage
    Brad Bradford 14286 38.6
    Norval Bryant 89 0.2
    Paul Bura 288 0.8
    Dragan Cimesa 77 0.2
    David Del Grande 283 0.8
    Diane Dyson 1612 4.4
    Matthew Kellway 13998 37.8
    Donald Lamoreux 141 0.4
    Brenda MacDonald 601 1.6
    Joshua Makuch 2315 6.2
    Valérie Maltais 929 2.5
    Frank Marra 142 0.4
    Paul Murton 74 0.2
    Morley Rosenberg 248 0.7
    Adam Smith 708 1.9
    Veronica Stephen 1257 3.4
  • Mapping the results of the 2018 election, Part I (updated)

    2018 Election - CityMayor25_150How each of Toronto’s 25 wards voted for mayor

    November 8, 2018: I updated this post to look at the results for fourth place mayoral candidate Saron Gebresellassi.

    I started this website four years ago after I began producing maps of the local council races and ward-level results of the 2014 municipal election and sharing them on Twitter. I figured that I would continue to map the results after the 2018 election. In this post, I start with the mayoral race results. Over the next two months, I will dive into the local council races as poll level data and poll boundary shapefiles are now available on the City of Toronto’s Open Data catalogue.

    John Tory’s landslide win this year was no surprise. Despite urban progressives’ frustration with his centre-right agenda, Tory has remained popular with a large segment of Toronto’s population. Until July of this year, there were no high profile challengers to Tory. Meanwhile the mayor assembled a campaign team that included Nick Kouvalis and Warren Kinsella, and had months to fund-raise a massive election war chest.

    Former Toronto chief planner Jennifer Keesmaat registered on July 27, 2018, the last day of nominations for mayor. Keesmaat decided to run for mayor after Tory delivered an inadequate response to Premier Doug Ford’s Bill 5 in July 2018, in which he called for a referendum rather than forcefully opposing Ford’s surprising and vindictive attack on Toronto City Council.

    Keesmaat did not have the time, organization, and money to make a strong campaign against Tory. Her platform was more progressive than Tory’s but still not distinctive or bold enough. Keesmaat even promised to keep property tax increases at or below the level of inflation, Tory’s key plank.

    It was no surprise that Tory was able to win with 63 percent of the vote, coming in first in all 25 wards, and 1599 of 1700 regular election day polls. Tory placed first in every poll won by Doug Ford in 2014.

    Keesmaat placed first in only 101 polls, with all except one of those being in the old City of Toronto (the other poll was York University).

    2018-election-citymayor.jpgPoll-by-poll results for the 2018 mayoral race

    Interestingly, but not too surprisingly, the polls in which Keesmaat placed first were very similar to those polls where Olivia Chow did best in 2014 — established west Downtown neighbourhoods such as the Annex, Little Italy-Palmerston, Seaton Village, the Junction, and Parkdale. Had the old 44 wards still been in use, Keesmaat would have placed first in three wards — old Wards 14, 18, and 19, the same as Chow’s results in 2014. These neighbourhoods are clearly the urban progressive base.

    Tory finished first in central and east downtown neighbourhoods, including the areas with younger, more diverse populations such as City Place, the Entertainment District, and Liberty Village. It’s also quite clear that Keesmaat failed to capture the imagination of large segments of Toronto’s population — especially in areas with large populations of immigrants and visible minorities. Any left-leaning challenger needs to win over not only the suburbs, but also downtown condo dwellers.


    Maps of the mayoral race results at the ward level, with the old 2014 ward boundaries

    Coming in third place in the 2018 mayoral election was white supremacist Faith Goldy, who managed to win over 25,000 votes, or 3.4 percent of all votes cast. Goldy fared poorly in most polls, and she failed to win more than 20 percent of the vote in any of those polls. But still, she was able to get over 10 percent of the votes in 16 polls across Toronto. They are mapped below. Goldy’s support was highest in the suburbs, especially central Etobicoke and in the Bathurst-Sheppard area, and in north Scarborough.

    2018-election-citymayor_fg.jpg
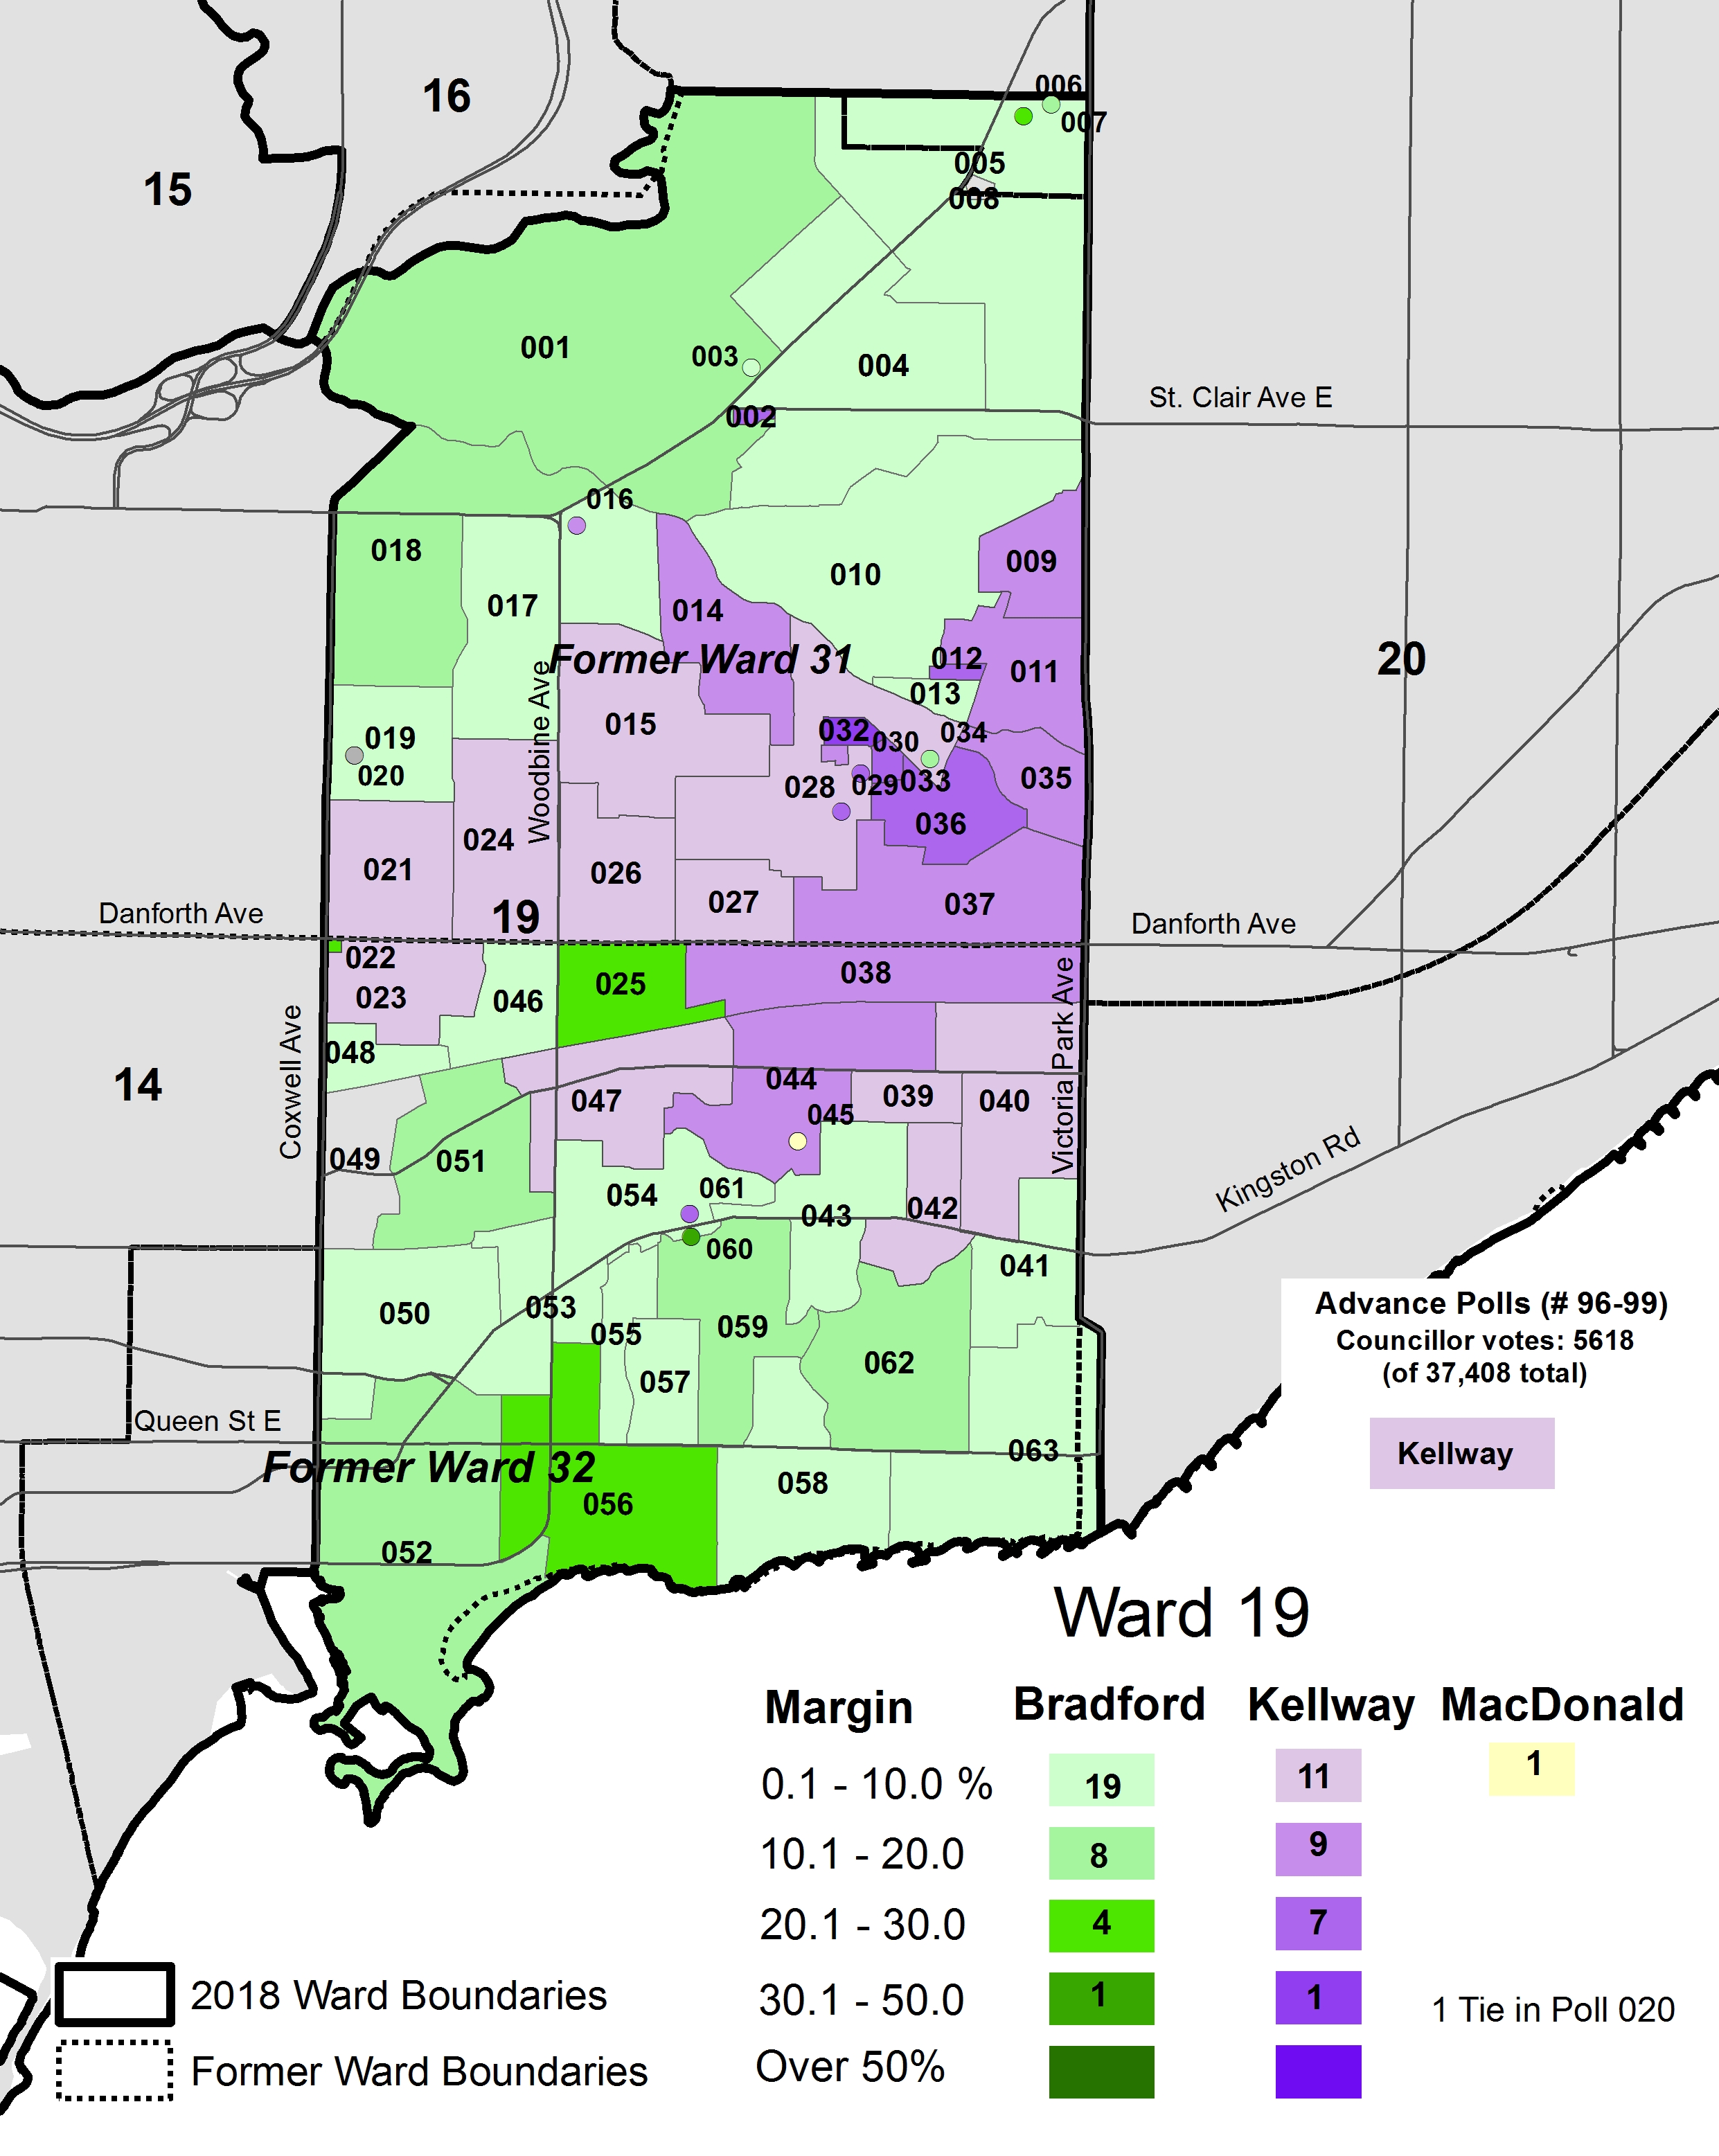
Most of those polls where Goldy got relatively high percentages of the vote had few total ballots cast. Poll 68 in Ward 17, a condo building near Leslie Street and Sheppard Avenue, had the highest vote percentage for Goldy, though this was only 7 of 35 total votes for mayor.  Poll 1 in Ward 19 had the highest absolute number of Faith Goldy supporters (excluding advance polls), with 86 out of 1030 mayoral votes cast.

    Still, it saddens me to see a xenophobic, racist fringe candidate get as much support as she did in Toronto, a city whose motto is “diversity our strength.”


    After I wrote this blog entry on Wednesday, Brittany Andrew-Amofah on Twitter suggested that I take a look at the results for fourth place candidate Saron Gebresellassi. Gebresellassi’s platform was stronger than Keesmaat’s, focusing on housing, transit, mental health supports, and opportunities for youth and racialized communities, especially in Toronto’s inner suburbs. Gebresellassi argued strongly for these issues at mayoral debates.

    Unfortunately, Gebresellassi only got 2 percent of the city-wide vote. She fared better in eight wards in central Toronto, as well as in York South-Weston, Humber River-Black Creek and Scarborough Southwest. Perhaps not coincidentally, these eleven wards were also the provincial ridings won by the NDP in the June provincial election. Gebresellassi’s highest support was in Ward 9 – Davenport, where she got 5.2% of all votes cast. Ward 9 is also where Keesmaat had the highest support, nearly beating Tory.

    2018 Election - CityMayor25_SG.jpgWard-level results for Saron Gebresellassi

    Gebresellassi took more than 10 percent of the vote in 17 polls. Many of these polls were located in Toronto Community Housing (TCH) buildings, co-ops, and shelters. Twenty-four percent of all voters in Poll 22 in Ward 13, located at a TCH property in St. Jamestown, chose Gebresellassi.

    Saron Gebresellassi spoke passionately about the right for safe and affordable housing, and many voters, especially those living in social housing took notice.

    2018-election-citymayor_sg-e1541722054979.jpg
    Poll-level results for Saron Gebresellassi. Polls in which Saron Gebresellassi got more than 10 percent of the vote are labelled; the three polls where she placed second (to John Tory) are underlined.


    As I mentioned before, I plan to take a close look at the council races over the next little while. Despite a frustrating and at times dispiriting municipal election here in Toronto, it’s worthwhile, I think, to look back at what happened. How did some incumbent councillors win, while others lost? How did the new boundaries change local dynamics?

  • Mapping the 2018 candidates for Toronto City Council, Bill 5 edition (updated)

    IMG_8629.jpg
    Toronto City Council voting on a legal challenge to Bill 5, August 20, 2018

    September 21 update: nominations are now closed, and I updated the map. Councillor Cesar Palacio dropped out in Davenport; this practically ensures that fellow incumbent Ana Bailao will be re-elected. There are 19 candidates in Toronto Centre, where popular incumbent Kristyn Wong-Tam is facing former mayoral candidate and provincial minister George Smitherman and appointed councillor Lucy Troisi.

    I’ll add a proper update later this weekend.

    September 19 update: the Ontario Court of Appeal ruled in the province’s favour today, issuing a stay of the September 10 Ontario Superior Court ruling against Bill 5. So with just over a month before election day, October 22, there’s now certainty that the 25 wards imposed by a vindictive Premier Ford will be used.

    That puts out a lot of good candidates looking to run in the 47-ward structure. Candidates Dan Fox in North York, and Chris Moise and Ausma Malik downtown, will not run. This is unfortunate and very disappointing.

    According to city hall reporter Arianne Robinson, incumbent councillors Paula Fletcher and Mary Fragedakis will run against each other in Toronto-Danforth.

    Without the City of Toronto’s online list of candidates live, I haven’t been able to make authoritative updates to the 25-ward map of candidates, but I have been trying to keep up with the news. Once the city’s list is live, I’ll make a definitive update.

    September 6 update: Councillor John Filion, who previously announced his retirement from municipal politics, registered to run in Ward 18 – Willowdale in the new 25 ward election. He felt his registration was necessary to prevent a non-progressive candidate from running (possibly David Shiner) and winning against relatively unknown candidates. It’s a terribly unfortunate result of going to 25 wards from 47 — it shuts out many fresh new faces and favours incumbents and other politicians with strong name recognition.

    Because of rapid population growth in the North Yonge corridor, Filion’s North York ward was essentially being split into two. Filion had endorsed his executive assistant, Markus O’Brien Fehr for the Ward 28 council seat, and Lily Cheng on Ward 29. If the challenge to Bill 5 is successful, and the 47 wards are restored for the 2018 election, Filion will not run.

    In other developments, the first battle between two progressive-leaning incumbents under the 25 ward model has emerged in Ward 12 – Toronto-St. Paul’s. Josh Matlow, an outspoken critic of John Tory’s transit plans, is running against longtime incumbent Joe Mihevc. Matlow is affiliated with the Liberals, while Mihevc is aligned with the NDP.

    There are now nine wards in which two sitting councillors are running against each other.

    I have updated the 25 ward map below.


    Bill 5, the so-called “Better Local Government Act, 2018,” was passed by the Ontario Legislature on August 14. This legislation reduces the number of council seats from the 47 wards approved by City Council to just 25, despite three years of study by independent experts and several rounds of public consultations. Passed in just over two weeks from the Premier Doug Ford’s surprise announcement on July 27 — the same day nominations for city council were scheduled to close — Bill 5 disrupted the municipal election campaign already in progress. Two hundred and ninety-two candidates had registered to run in one of the approved 47 wards.

    Bill 5 is vindictive, grossly unfair, and sets a bad precedent for provincial meddling in municipal affairs. It only targets the City of Toronto, which rejected Doug Ford’s late run for mayor in 2014, and delivers a blow to hundreds of candidates that registered to run in good faith. But legally, the City of Toronto must follow the province’s edict and elect only 25 councillors with wards based on the current provincial riding boundaries.

    Before Bill 5 was announced, there was an excellent chance for renewal at Toronto City Hall. Councillors Janet Davis, John Filion, and Mary-Margaret McMahon announced their retirements, while Shelley Carroll and Chin Lee resigned to run in the June 2018 provincial election. Councillors Ron Moeser and Pam McConnell died in office, replaced by appointees who promised not to stand for election (though Lucy Trosi later broke this promise). Councillor Josh Colle announced that he, too, was not going to run for re-election, but his father, defeated MPP and former councillor Mike Colle, would run instead. Meanwhile, Justin Di Ciano and David Shiner never registered.

    With three new wards, this meant that there were up to thirteen open races without an established incumbent. With only 25 wards, all but two wards are guaranteed to have at least one incumbent running for re-election, and at least ten wards with two incumbents running against each other.

    On Monday, August 19, nominations opened for any candidate wishing to run in one of the 25 wards. Nominations will close at 2:00 PM on September 14, just over five weeks before election day on October 22. Council candidates who registered under the 47 ward system or the 25 ward system may also withdraw by that date.

    There remains a faint hope that a court case, scheduled to be held on Friday August 31 will delay or overturn the provincial legislation, allowing the planned 47-ward election to go ahead.

    I expect that many candidates, especially progressive incumbents and challengers not eager to face off against each other, will wait until then to decide. But sadly, it means that great people like Chris Moise, who registered to run in Ward 25, will withdraw from the race.

    I will be maintaining and updating a Google map of the 25 ward races, similar to my 47-ward map. This new map appears below.

    As of Tuesday, August 28, there are eight wards in which two incumbents are running against each other. For example in Ward 1, Etobicoke North, Ford ally Vincent Crisanti will be running against Michael Ford, nephew of late mayor Rob Ford and Premier Doug Ford.

    But downtown, no incumbent councillors or high-profile candidates have registered under the new boundaries. I suspect they, like many of us, are waiting to find out what will happen on August 31, and that if the 25 wards go ahead, we will lose some promising new choices for city council.

  • Why Doug Ford’s plan for 25 Toronto wards is an attack on local democracy

    Ridings and 47 Wards.jpgMap of Doug Ford’s proposed 25 wards and the City Council-approved 47 ward boundaries

    Late last week, the newly elected Ontario Progressive Conservative government announced that they would be imposing a new electoral map on the City of Toronto, a decision that would eliminate the new 47 wards approved by Toronto City Council, replacing them with the same 25 boundaries used by the federal and provincial governments.

    It’s very clear that Premier Doug Ford’s plan, which requires a new piece of legislation, ironically titled the “Better Local Government Act,” is vindictive and mean-spirited because it only affects the City of Toronto, which rejected Doug Ford’s 2014 mayoral bid. It quashes the hopes of many young, racialized, and progressive candidates looking to change the make up of a council that has generally supported Mayor John Tory’s agenda. It is unfair to candidates that ran in good faith, started campaigns, raised funds, and spent money hiring staff, purchasing materials, and renting campaign offices.

    But most of all, Ford’s actions are an attack on local democracy because of the haste with which they are being made, at the end of the nomination period for those approved 47 wards. They ignore the years of study by independent experts and several rounds of public consultations. They also benefit Toronto’s suburban areas, which are growing at a far slower rate than downtown Toronto, North York Centre and Etobicoke’s waterfront area, which will be disproportionately affected by this arbitrary decision.

    Each new ward was designed to have an average population of 61,000, with a population range of between 51,800 and 72,000 (+/- 15%). They were designed to last for four election cycles, to be re-drawn before the 2034 election.

    It is worth noting that the independent experts looked at using the 25 federal/provincial boundaries twice. In the first study, they were rejected early on because they would not “meet the tests of effective representation.” The federal boundaries, which are also adopted by the province of Ontario, are based on population counts from the 2011 Census, and are already seven years out-of-date, while the consultants were tasked with developing new ward boundaries to last 16 years. Even a 50-ward solution (which mimics the old 44 wards based on the 22 federal ridings that were established in 1996 and came into effect with the 1997 federal election) would result in severe variations in population.

    Ridings and 2026 pop variation.jpgHow the 25 ridings, if used for Toronto’s ward boundaries, will vary in population by 2026

    After Tory’s Executive Committee tasked the Toronto Ward Boundary Review team to re-examine options that would see fewer than 47 councillors elected in 2018, they re-examined using the 25 ward boundaries. They found that in 2026, three of those wards — Toronto Centre, Etobicoke-Lakeshore, and Spadina-Fort York — would have populations over 30% higher than the ward average in 2026. Willowdale and University-Rosedale would also have had much larger populations than the city average.

    The review team also looked at a 26-ward option that mostly maintained the riding boundaries but added a new ward downtown out of the Toronto Centre and Spadina-Fort York constituencies and adjusted boundaries in southern Etobicoke. Even then, Etobicoke Centre and Etobicoke-Lakeshore would still have populations over 20% higher than the city-wide average. Despite making some adjustments for population growth, this option would have not have corresponded with some ridings, and was also not recommended.

    26 Wards and 2026 pop variation.jpgHow the modified 26 ridings, if used for Toronto’s ward boundaries, would have varied in population in 2026

    For those reasons, and to support local representation, the 47-ward solution was once again recommended, and was approved by City Council in November 2016. Councillors Justin Di Ciano (Ward 5) and Giorgio Mammoliti (Ward 7) then appealed the new boundaries to the Ontario Municipal Board, but they were dismissed. The 47-ward solution has survived despite it all.

    Mayor Tory may have brought back decorum to the mayor’s office after an embarrassing period under Doug Ford’s brother Rob, but he has pushed an austerity agenda, and has failed to show leadership on police reform, wasteful infrastructure spending, and safe streets for pedestrians and cyclists. His initial reaction, to call for a referendum on Ford’s plan to cut Toronto’s council, was a characteristically weak response; he was later pushed into supporting a legal challenge by an angry public. Meanwhile, some of Tory’s allies, like Di Ciano, David Shiner, and Glenn De Baeremaeker, support Ford’s actions.

    Ford’s attack on local democracy is an insult to candidates who have already put their names forward for election and launched their campaigns. It undermines the City of Toronto’s legislated responsibility to decide its own ward boundaries. And it will only exasperate existing disparities in council representation.

  • Mapping Toronto’s approved new ward boundaries

    18506683800_6c96dcc66b_k

    On Monday, October 22, 2018, Torontonians will be electing a new city council. And for the first time since 2000, Toronto’s ward boundaries will be changing.

    When the new council is formed on December 1, 2018, there will be 47 wards, up from 44. Downtown Toronto will gain three new seats, and North York will gain one, but one seat is lost in Toronto’s west end, in an area currently represented by Wards 14, 17, and 18. Seven wards in Etobicoke, North York, and Scarborough will remain unchanged.

    Earlier this week, the City of Toronto added the new boundaries to its open data catalogue, so I used the data to create an interactive Google map. This map, embedded below, shows both the current 44 wards, and the approved new 47 wards. Each of the two ward boundary layers can be turned on and off.


    Google map showing current and approved new ward boundaries

    These new ward boundaries are the result of a long four-year study and consultation process, and represent a compromise that improves representation in high-growth areas, while minimizing the loss of council representation elsewhere. Several other options were explored, including reducing the number of councillors to 25, but they were rejected by the consultants hired by the city to draw the new wards; they were also unpopular among members of the public who attended the consultations.

    While Toronto City Council approved the new boundaries in November 2016 (despite Mayor John Tory’s opposition), Councillors Justin Di Ciano (Ward 5) and Giorgio Mammoliti (Ward 7) appealed the new boundaries to the Ontario Municipal Board. Happily, the OMB dismissed the two councillors’ complaints last month. Both councillors are likely to run for re-election in modified versions of their existing wards.

    I will update the interactive map, adding candidate names for each of the new wards. Nominations are open from May 1, 2018 through July 27, 2018.

    Thanks to Gil Meslin (@g_meslin), who altered me to the fact that the new ward boundaries were available on the city’s website. 

  • Brampton Transit’s evolution from a laggard to a leader

    5010657604_d3cd2c355a_o.jpg
    The introduction of Brampton Transit’s Zum service in 2010, serving York University, was a major turning point for the suburban transit agency

    For TVO this week, I discuss Brampton Transit’s impressive ridership growth. In the last five years, Brampton Transit has bucked the trend of stagnant ridership numbers encountered elsewhere in the Greater Toronto Area and North America in general. I argue that Brampton’s success in improving transit ridership comes from sustained investment over many years, the move to a grid-based route structure, and the introduction of Züm, a basic network of semi-frequent, limited-stop bus routes, many of which extend outside of Brampton’s boundaries.


    I grew up in Brampton, and I have collected maps since kindergarten; my collection includes several old Brampton Transit maps. These maps help to illustrate the progress made since the 1980s, when the level of service provided was quite basic.

    Brampton Transit began operations in 1976 after the old Town of Brampton’s local bus service was amalgamated with the dial-a-bus service operated in Bramalea. (Brampton amalgamated with most of Chinguacousy Township in 1974, including Bramalea.) In 1980, Brampton Transit operated 14 routes, serving a community of just under 150,000 people. Buses operated no later than 9:00 or 10:00 PM, Mondays through Saturdays, and many routes operated with long, meandering loops. Apart from GO Transit, there were no connections to nearby communities.

    Brampton Transit - December 1980 front
    December 1980 Brampton Transit map

    By 1988, service was offered on Steeles Avenue to Humberline Drive in Etobicoke, where connections could be made to TTC buses on the 96 Wilson and 73 Royal York buses, but didn’t continue east to Humber College. Brampton Transit Route 14 Torbram served Westwood Mall in Mississauga, and connections to Mississauga Transit could be made at Shoppers World. But still, service levels were poor — you were lucky to get a bus every 30 minutes outside of rush hours. Permanent Sunday service wouldn’t come for another ten years. Notable are the four lettered bus routes — A, B, C, and D — that made direct connections to the four weekday GO train round trips to and from Toronto.

    Brampton Transit’s maps of the era are also historically notable because of their advertising: only one of the Burger King locations shown on the 1988 map still exists. Other restaurants advertised — the Old Beef Market, O’Henry’s, and Queen’s Pizzeria — are no longer in business.

    Brampton Transit - 1988
    September 1988 Brampton Transit Map


    Brampton Transit Maps published in the 1990s and early 2000s were printed on newsprint, and used only a two-colour scheme: blue for regular routes, and orange for rush-hour routes. Service to new subdivisions was often provided by way of long one-way loops, which is an inexpensive way of serving new areas, but are inconvenient and slow for potential riders.

    Notable in the 2001 map below is Route 77, launched in the 1990s as a joint Brampton Transit/Vaughan Transit route between Bramalea City Centre and Finch Station along Highway 7. Route 77 was a very slow way to get to the subway from Brampton, but it operated until Züm began service in 2010. In 2001, bus service on 11 Steeles was finally extended to Humber College’s main campus.

    Brampton Transit, 2002
    September 2001 Brampton Transit map

    2005 marked an important turning point for Brampton Transit, as it introduced a grid-based route system on major arterials. Route 14 Torbram, for example, no longer served Bramalea City Centre, but continued north, providing a core north-south route; many other routes were straightened, including Route 2 Main north of Downtown. Changes since May 2005 saw service frequencies improved, more local routes added, and improved connections.

    Brampton Transit - 2005 front
    May 2005 Brampton Transit map

    The current system map, dated September 2017, can be found on Brampton Transit’s website.

  • Mapping Toronto’s population growth

    Data geeks across Canada were eagerly awaiting this day — February 8, 2017 — the first release of the 2016 Canadian Census of the Population. Today’s release only covers population and dwelling counts, further information on age, sex, household characteristics, as well as language, immigration status, employment, income, and other variables will be released later in 2017. The 2016 Census included the mandatory long-form census, which will provide a robust snapshot on the socioeconomic status of all 36 million Canadians.

    I created three quick maps showing the population growth in the City of Toronto by census tract. The City of Toronto grew by 116,511 people over five years to 2,731,571 in 2016, a 4.45% increase. Some suburban municipalities grew much faster, like Brampton  (13.3%, with a 2016 population of 593,638), but Toronto has been able to absorb one-third of the Toronto Census Metropolitan Area’s growth.

    Toronto’s population makes up 46.1 % of the Toronto CMA (population 5,928,040). The rest of that growth was found in mature suburbs such as Brampton, Mississauga, and Markham, but also in quickly-growing towns such as Milton (population 110,128, up 30.5% from 2011). While some suburbs — Mississauga and Markham in particular — have been establishing higher-density urban centres with mid and high rise condominiums, most of the suburban growth has come from single-family homes and townhouses on formerly agricultural lands. If the Greenbelt is to continue being successful in containing sprawl and preserving productive farms and natural areas, Toronto needs to absorb even more growth in the next few decades. Land developers, speculators and the real-estate industry, however, are pushing back.

    The first of the three maps shows the percentage increase or decrease in population by census tract. Areas with higher growth are concentrated in Downtown (particularly along Yonge Street and in the Entertainment District, City Place, Liberty Village-Fort York and St. Lawrence-Distillery-Corktown), as well as Etobicoke Centre, on Humber Bay, Midtown, and along the Sheppard Subway corridor in North York. Not surprisingly, these are areas in which new housing developments, particularly condo towers, are being built. Other neighbourhoods, for the most part, are seeing minor increases or decreases in population, likely related to changes in household/family size.

    gta-2016-census
    Population change between 2011 and 2016 by percentage by census tract, Toronto
    (Alternate colour scheme available here and here)

    But more interesting is the map showing absolute population increases or decreases between 2011 and 2016. It better illustrates areas of high population growth and neighbourhoods with population decline. The inner suburbs, especially parts of Scarborough and North York, clearly show slight a population decline compared to the high-growth areas described above.

    gta-2016-census-absolute-change
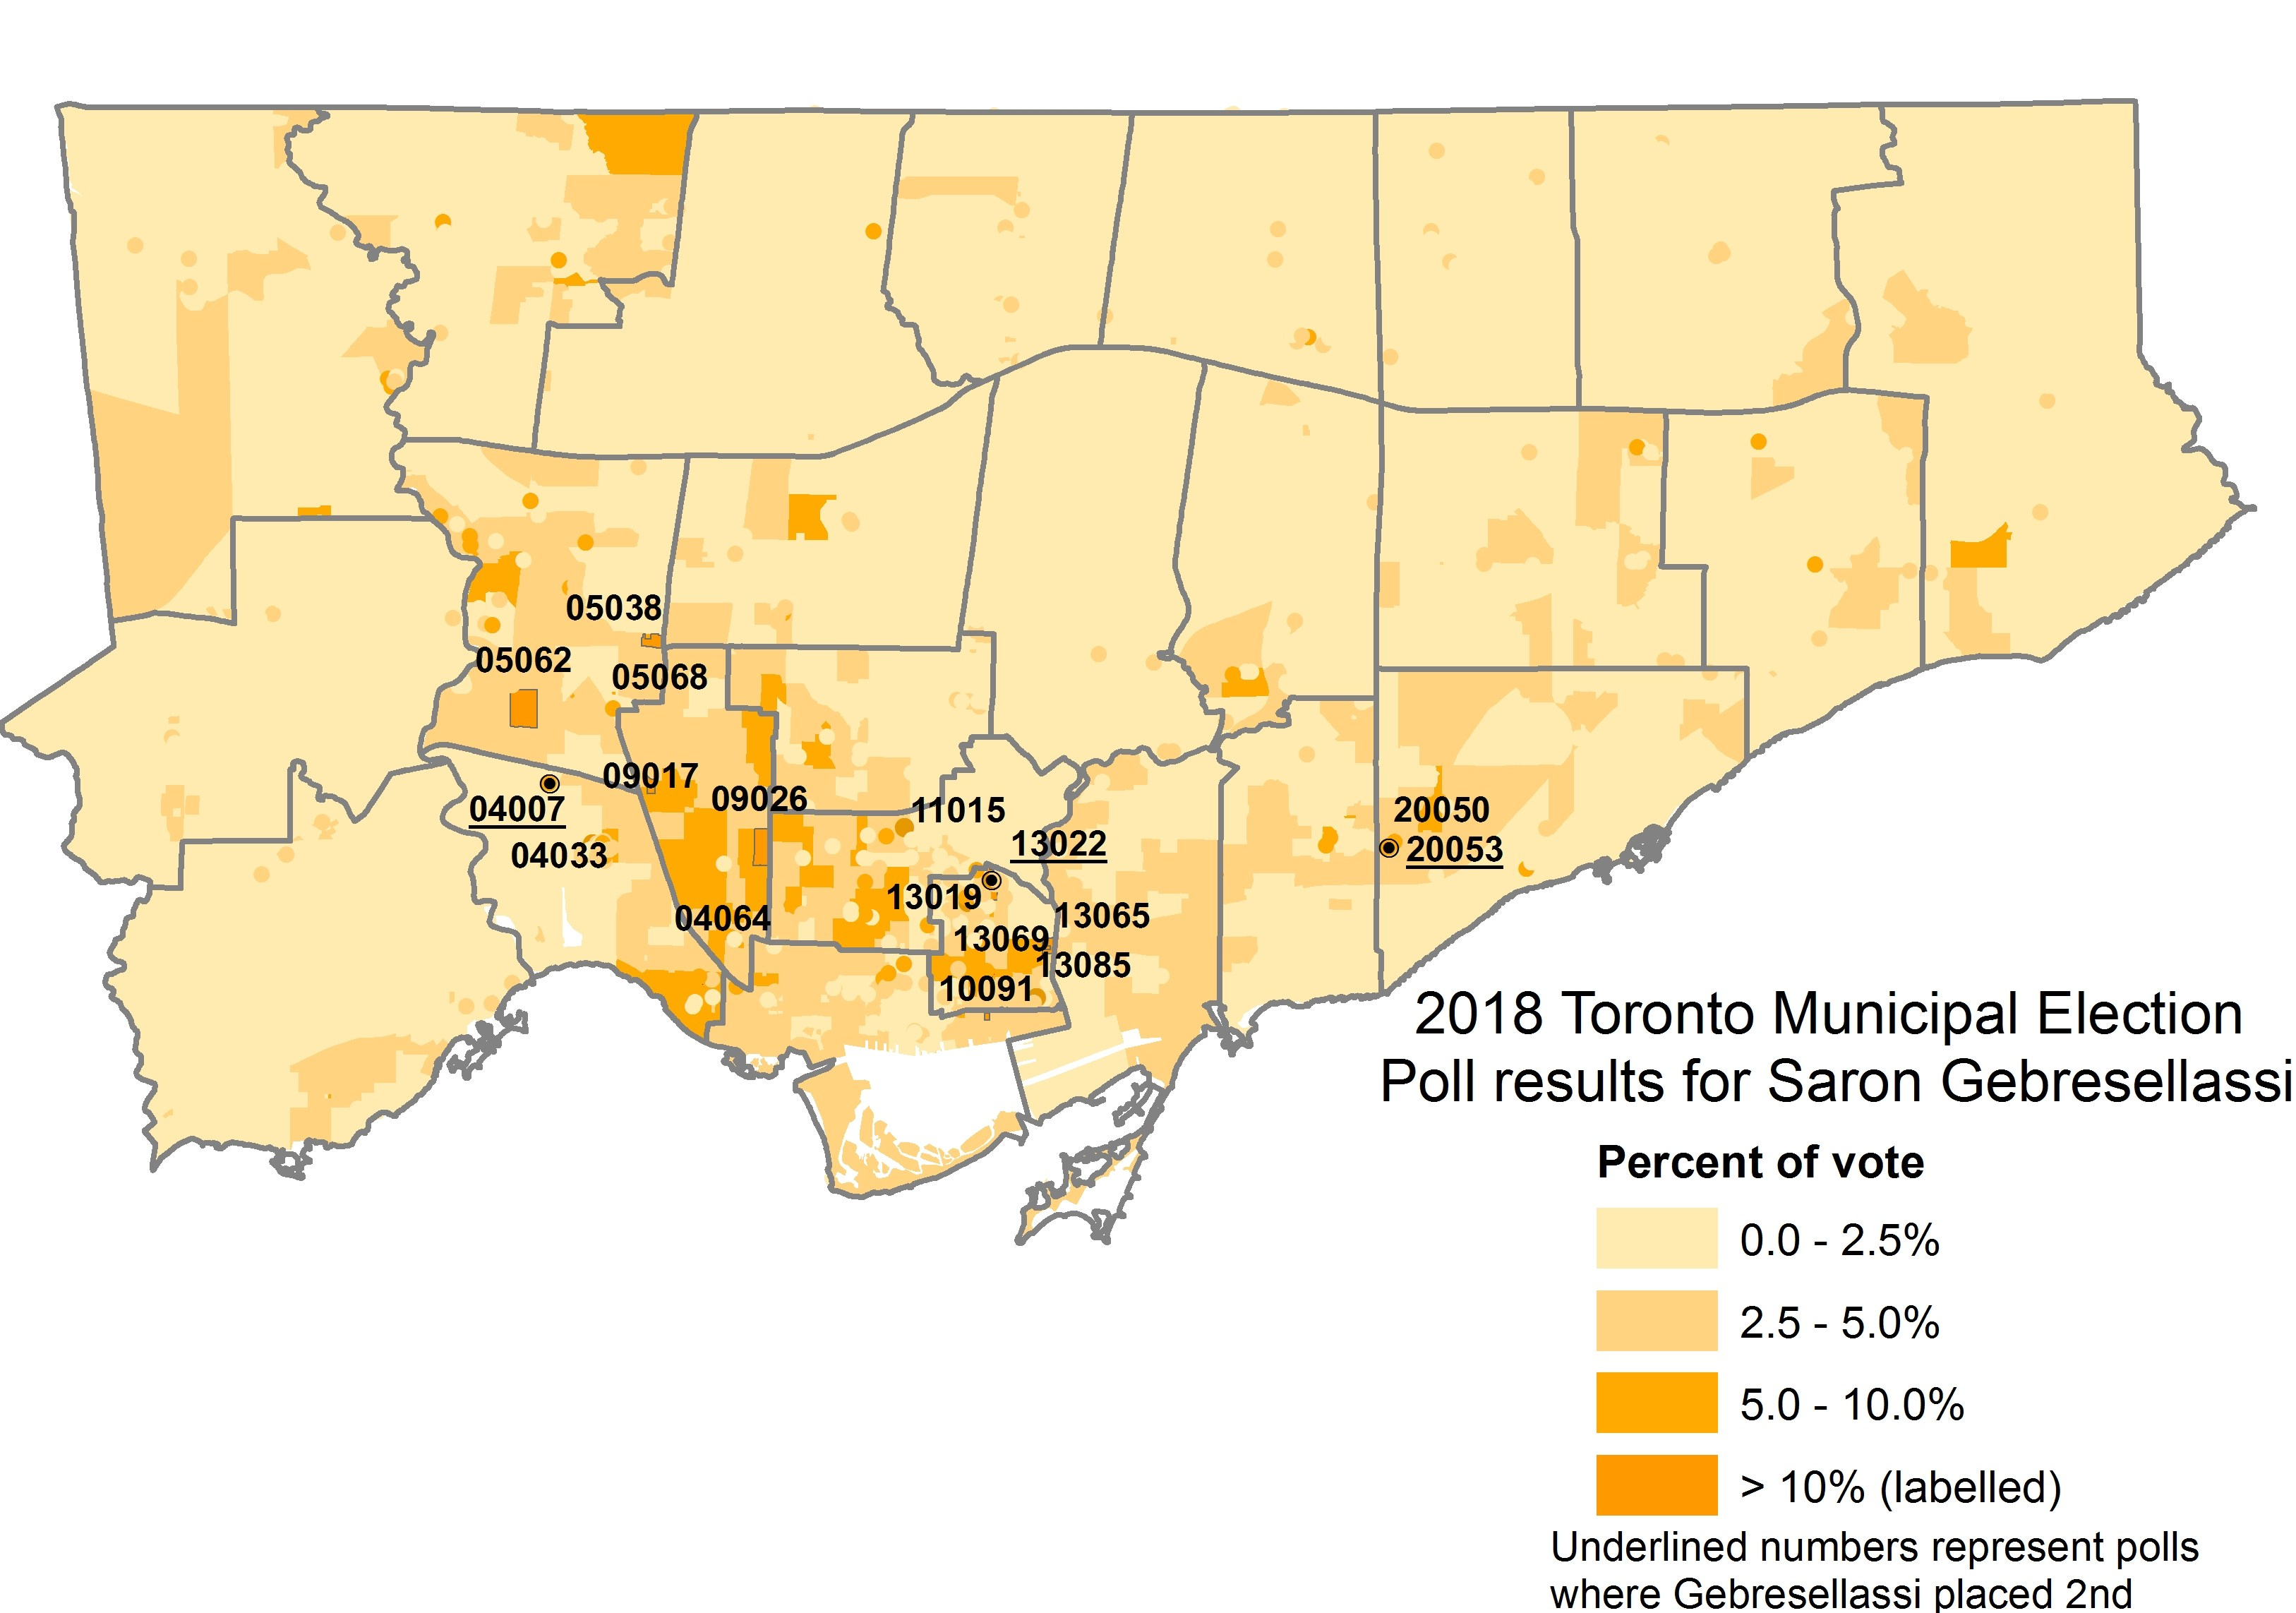
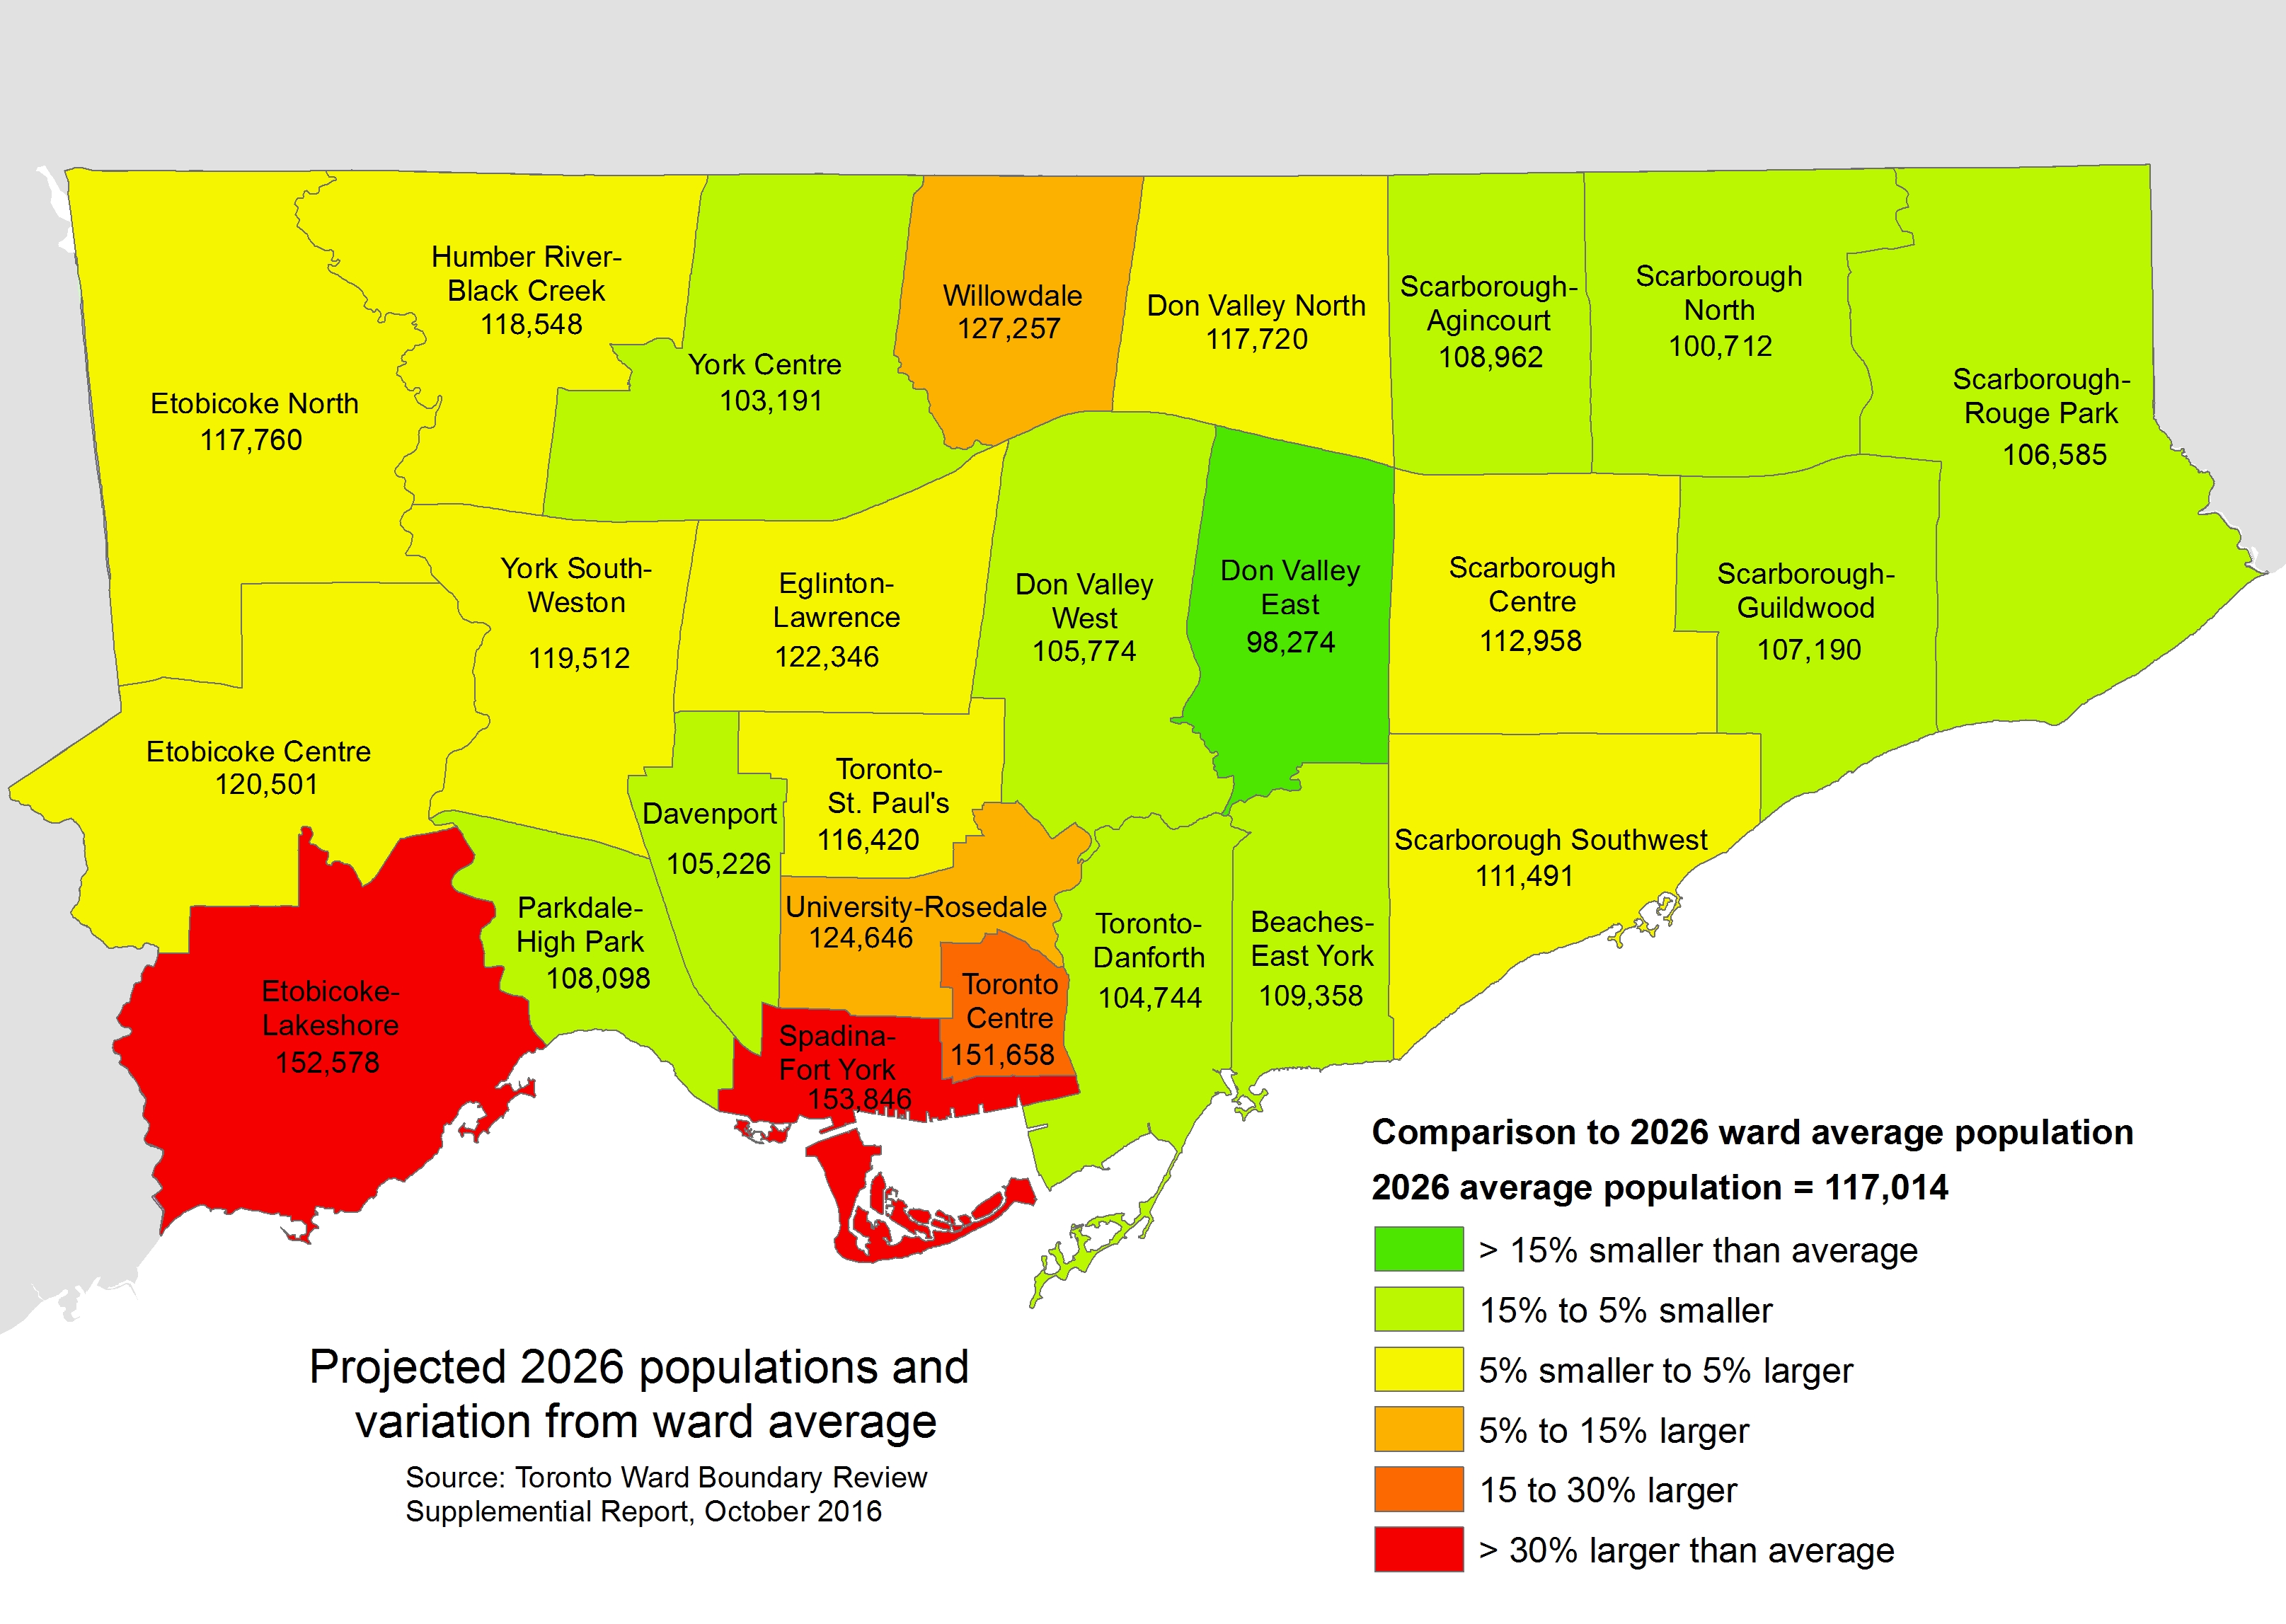
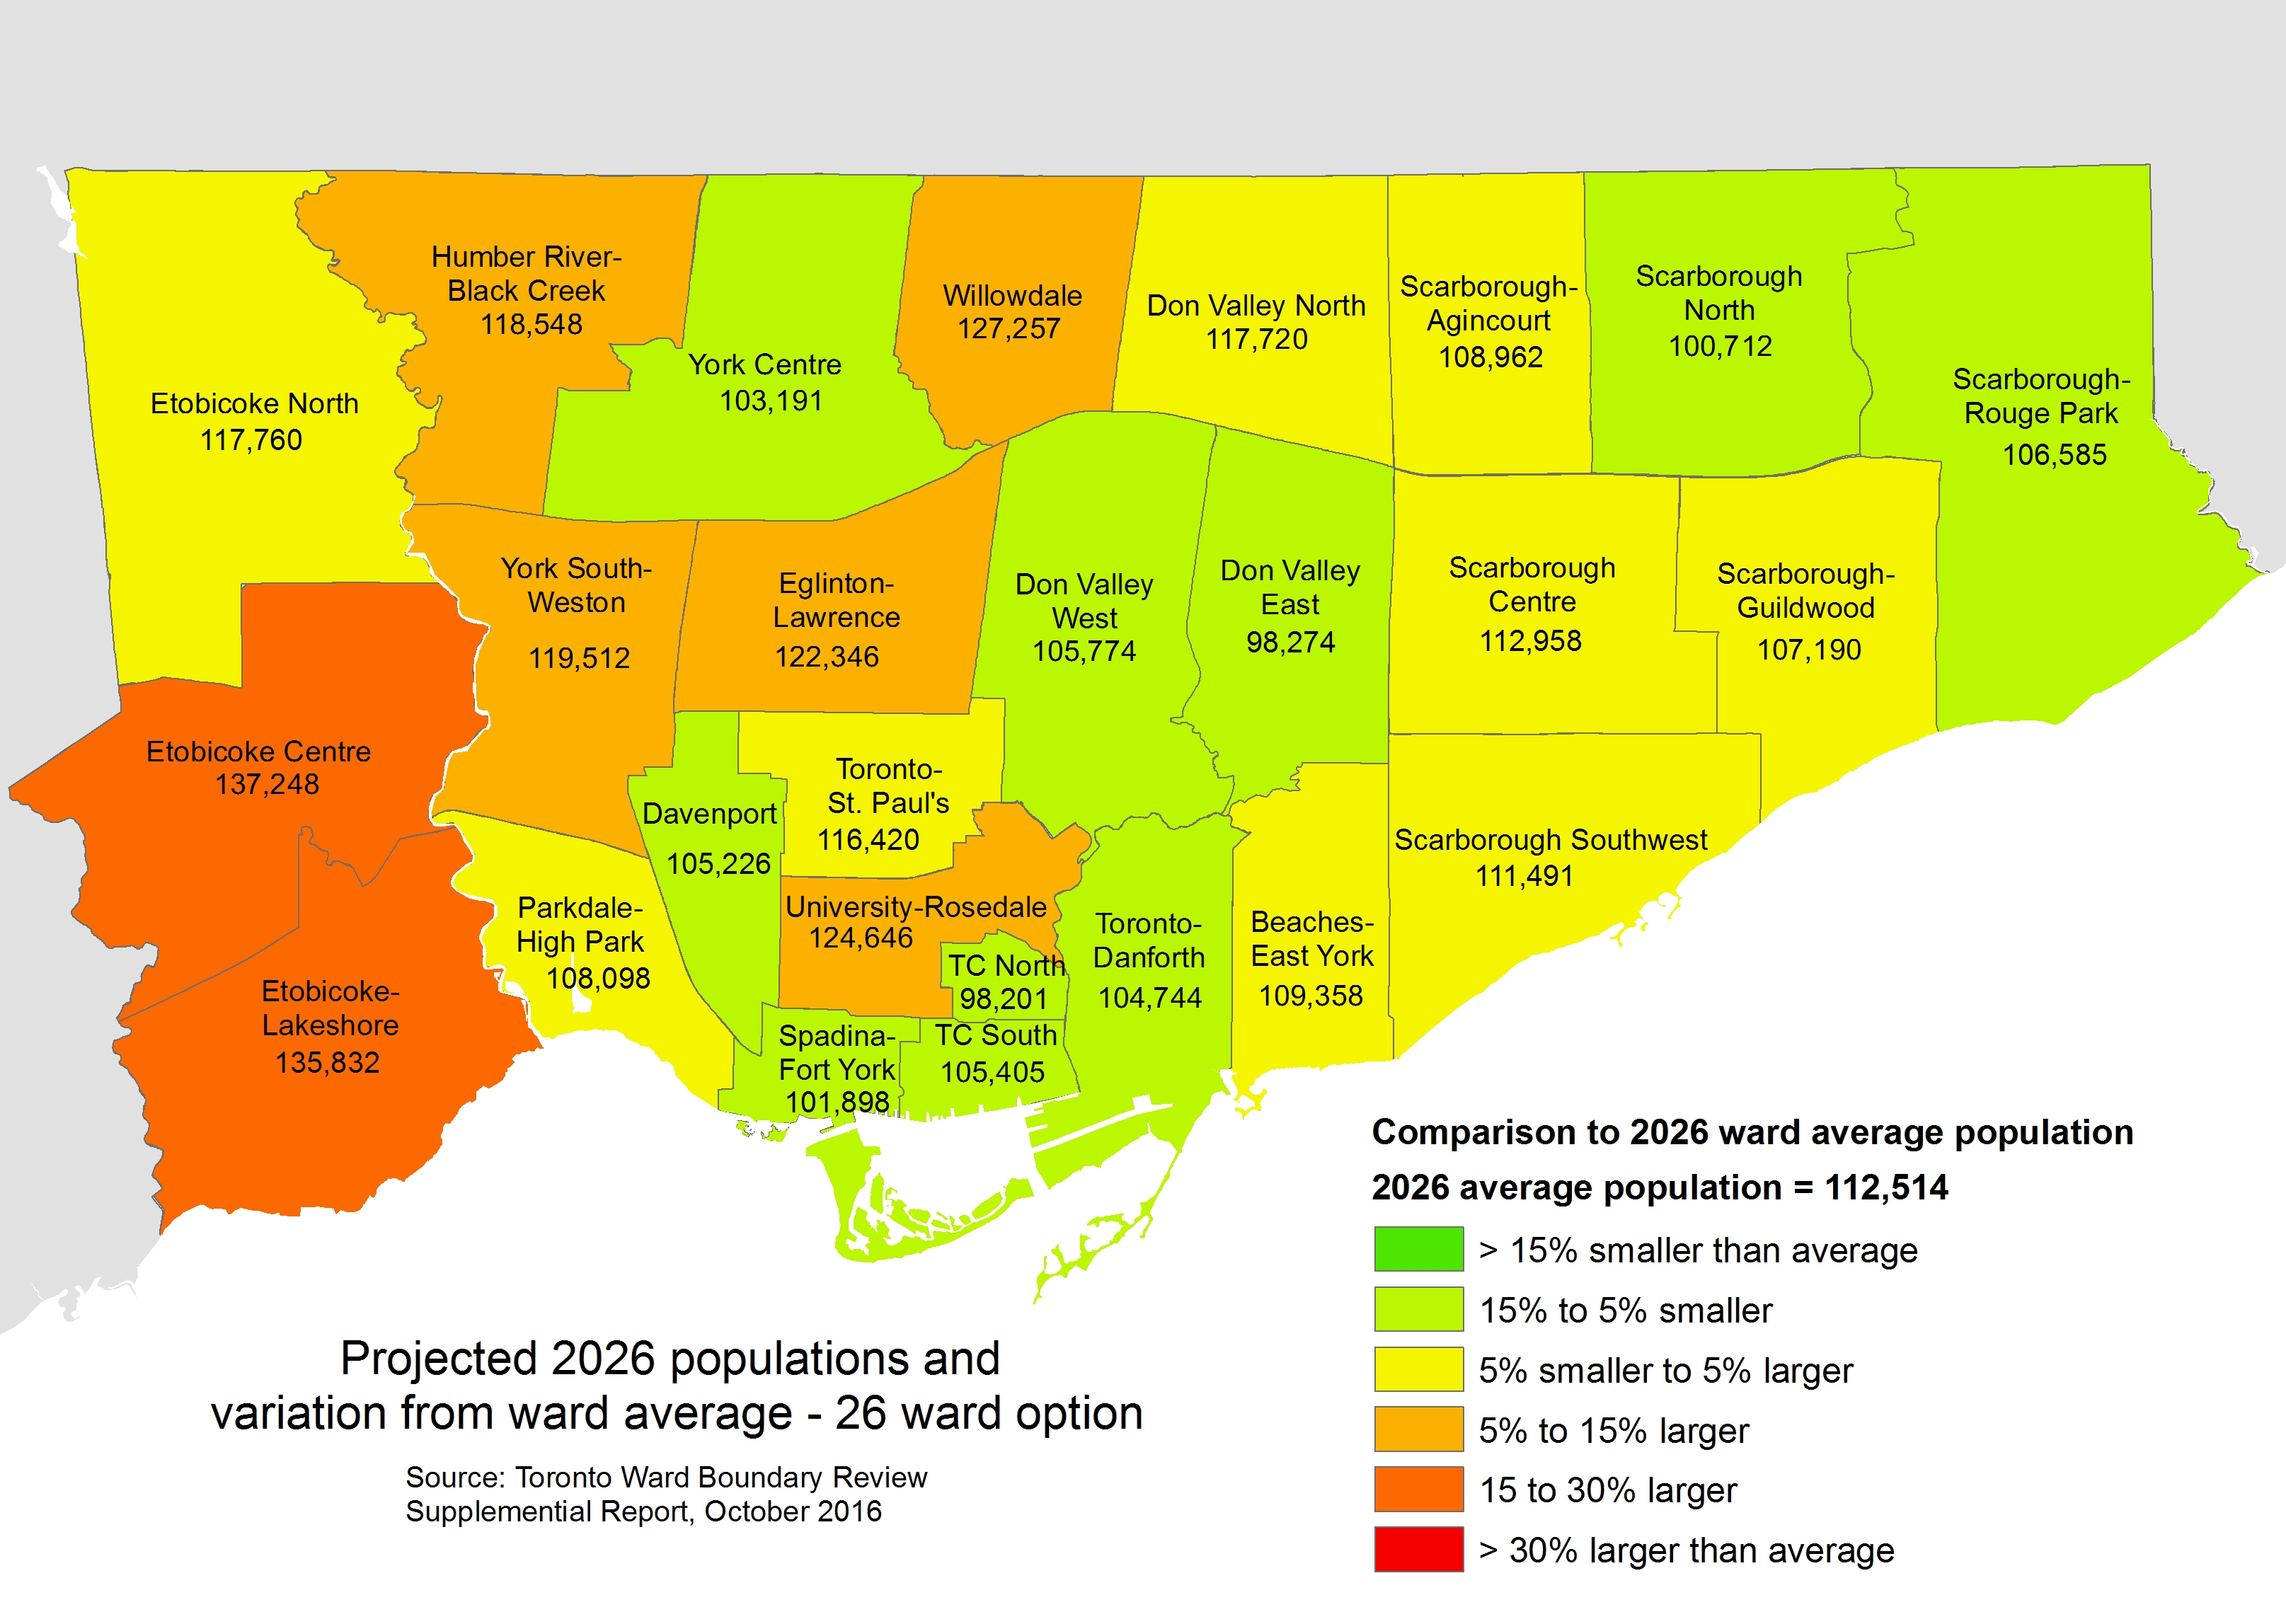
Population change between 2011 and 2016 by absolute numbers by census tract, Toronto
    (Alternate colour scheme available here and here)

    The final map shows the 63 census tracts (out of a total of 1,426 CTs) with growth of at least 2,000 persons. It very clearly shows where high population growth has taken place.

    GTA 2016 Census Toronto High Growth.jpgCensus tracts that grew by at least 2,000 persons between 2011 and 2016

  • Mapping Toronto’s streetcar network: The age of electric – 1891 to 1921

    People & Historic shots. - [1920?]-1987

    TRC streetcars on Queen Street, c. 1910. Note the old TSR horsecars used as trailers behind the electric cars. City of Toronto Archives, Series 1465, File 722, Item 18

    This post continues from The Horsecar Era: 1861 to 1891 

    In 1891, after obtaining a new 30-year franchise, the Toronto Railway Company went to work electrifying Toronto’s streetcar system. The TRC was a private company, led by William Mackenzie and James Ross. Mackenzie made his fortune in railway construction; together with Donald Mann, he would go on to build a railway empire before it collapsed by the end of the First World War. Mackenzie would also control other street railway and interurban lines in Ontario, including the Toronto and York, the Toronto Suburban, and the Niagara, St. Catharines, and Toronto.

    By 1894, the TRC became fully electrified, providing quicker and more reliable service. In the twenty-five years that followed, new electric railways radiated out of Toronto to points such as West Hill in Scarborough, Port Credit, Woodbridge, and even as far away as Lake Simcoe and Guelph. But after a short sprint of service expansion within the City of Toronto, the TRC refused to extend its services beyond Toronto’s city borders of 1891. The City of Toronto was forced to form its own public streetcar company in 1911, and became determined to take complete control over urban transportation services once the TRC’s franchise came to an end.

    Maps presented only show revenue routes, including peak period variations and some seasonal routes, such as Exhibition services. I omit some minor service and route changes. I welcome constructive feedback as I plan to re-publish these maps elsewhere.

    1894

    Electrification of the Toronto Railway Company began when the Church Street line was converted on August 16, 1892. The last horsecar made its trip on McCaul Street on July 18, 1894. The TRC extended several routes in Toronto’s west end, including King, Dovercourt, Bloor, Dundas and Carlton.

    The Davenport Street Railway Company began operations on September 6, 1892 between Toronto Junction at Keele and Dundas Streets, and Bathurst Street at the CPR tracks, a short walk to TRC Bathurst Cars. The Weston, High Park & Toronto Street Railway Company began operating the same year within the Junction, from Evelyn Crescent to Keele Street, later extending east to the Toronto City Limits at Humberside Avenue. These two companies merged in 1894 to create the Toronto Suburban Railway.

    The Toronto and Mimico Railway was the city’s second radial. After a troubled start in 1892, it extended west to New Toronto by 1894. The Toronto and York built east from Queen Street and Kingston Road to Blantyre Avenue in Scarborough Township. Two short spurs served the town of East Toronto (near today’s Main/Gerrard intersection) and down to the Beach.

    ttc-streetcars-1894

    (more…)

  • Mapping Toronto’s streetcar network: The horsecar era – 1861 to 1891

    Horse car, with J. Gibbons, conductor, and J. Badgerow, driver, at Old North Toronto Station
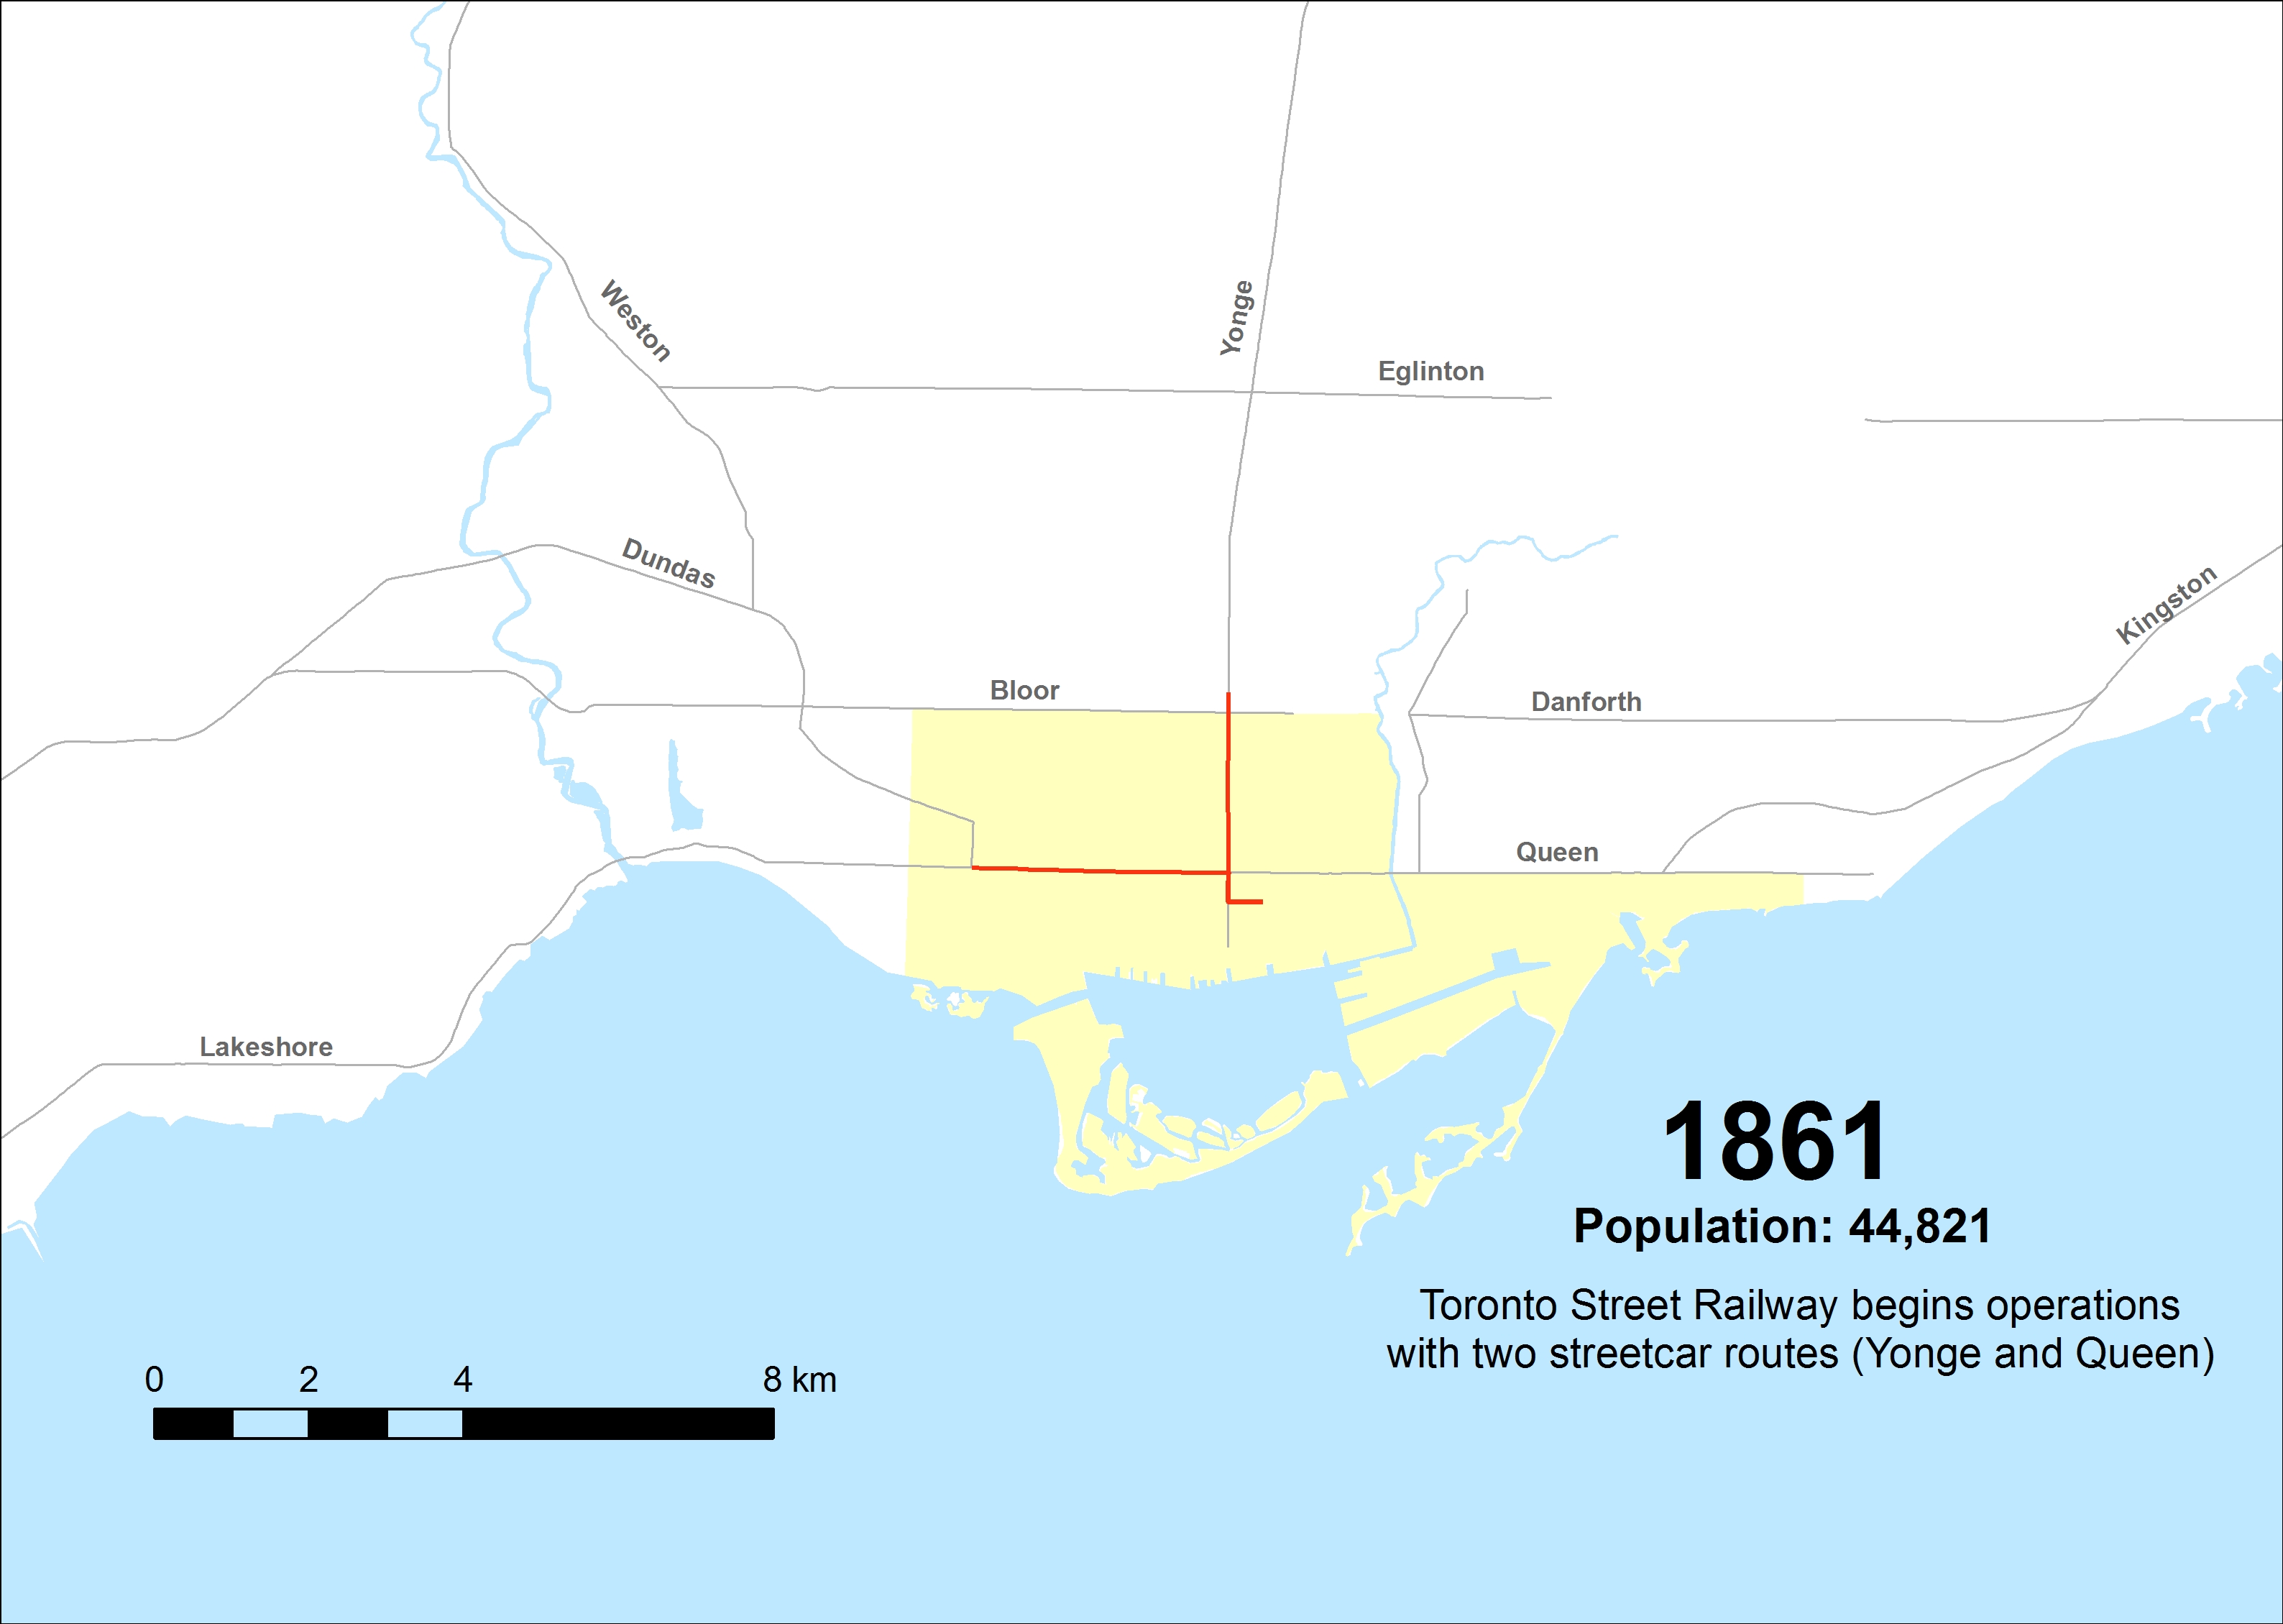
Toronto Street Railway horse car on Yonge Street at the Canadian Pacific Railway crossing, after 1885. From City of Toronto Archives, Fords 16, Series 71, Item 3367

    Over the last few months, I have researched many books and maps and created a series of maps that attempt to illustrate the history of Toronto’s street railways, from 1861 to the present. Toronto is one of only a few cities in North America to continually operate a street railway network (others include Boston, Philadelphia, San Francisco, and New Orleans), which remains one of the busiest and most expansive tram systems in the world.

    Before the Toronto Transportation Commission was created in 1921, Toronto was served by several private streetcar firms. The Toronto Street Railway, which began operations in 1861, built Canada’s first streetcar system; two routes were opened that year, with small railcars pulled by horses. The TSR’s successor, the Toronto Railway Company, electrified the network, but with few exceptions, refused to expand it beyond Toronto’s 1891 borders. Only with the creation of the publicly owned TTC was Toronto’s streetcar system unified and modernized to be the envy of cities across the continent.

    Creating these 38 maps was a challenge, because published materials covering the pre-TTC era (before 1921) are sparse. William Hood’s Street Railways : Toronto: 1861 to 1930 provides some history of Toronto’s earliest transit services, but with only some details. I also consulted Transit Toronto’s route histories and other books such as Robert M. Stamp’s Riding the Radials and John F. Bromley’s Fifty Years of Progressive Transit which covers the years from 1921 to 1971.

    This post, the first of three, will cover the years from 1861 to 1891, the era of the Toronto Street Railway (TSR), when horse power ruled the streets. I do not cover every year, and I omit some minor service and route changes. But this, I hope, accurately illustrates the rise, fall, and renaissance of Toronto’s streetcar system.

    1861
    The TSR begins operations on September 10, 1861, serving a small provincial city of less than 50,000 people. The first route, Yonge, operates from Yorkville Town Hall, just north of the city limits, to St. Lawrence Market at King and Jarvis. A second route, Queen, was established in December of 1861, running between the market and the Ontario Hospital at the corner of Dundas Street, now Ossington Avenue.

    ttc-streetcars-1861

    (more…)