Category: Toronto

  • A good, a bad, and an ugly week for Toronto transit

    There was some good transit news for Torontonians today, as the provincial government announced $150 million in funding for detailed study and engineering for the planned Relief Line subway. The preferred route and station locations for the first phase of the new subway line was also released this week, with eight stops from Pape to Osgoode Stations.

    Happily, the Relief Line, an idea that’s over one hundred years old, Toronto’s answer to New York’s Second Avenue Subway, is closer to being built than ever before. As Steve Munro reports, the study will focus initially on the portion from Pape to downtown, but will shift to the northern and western extensions.

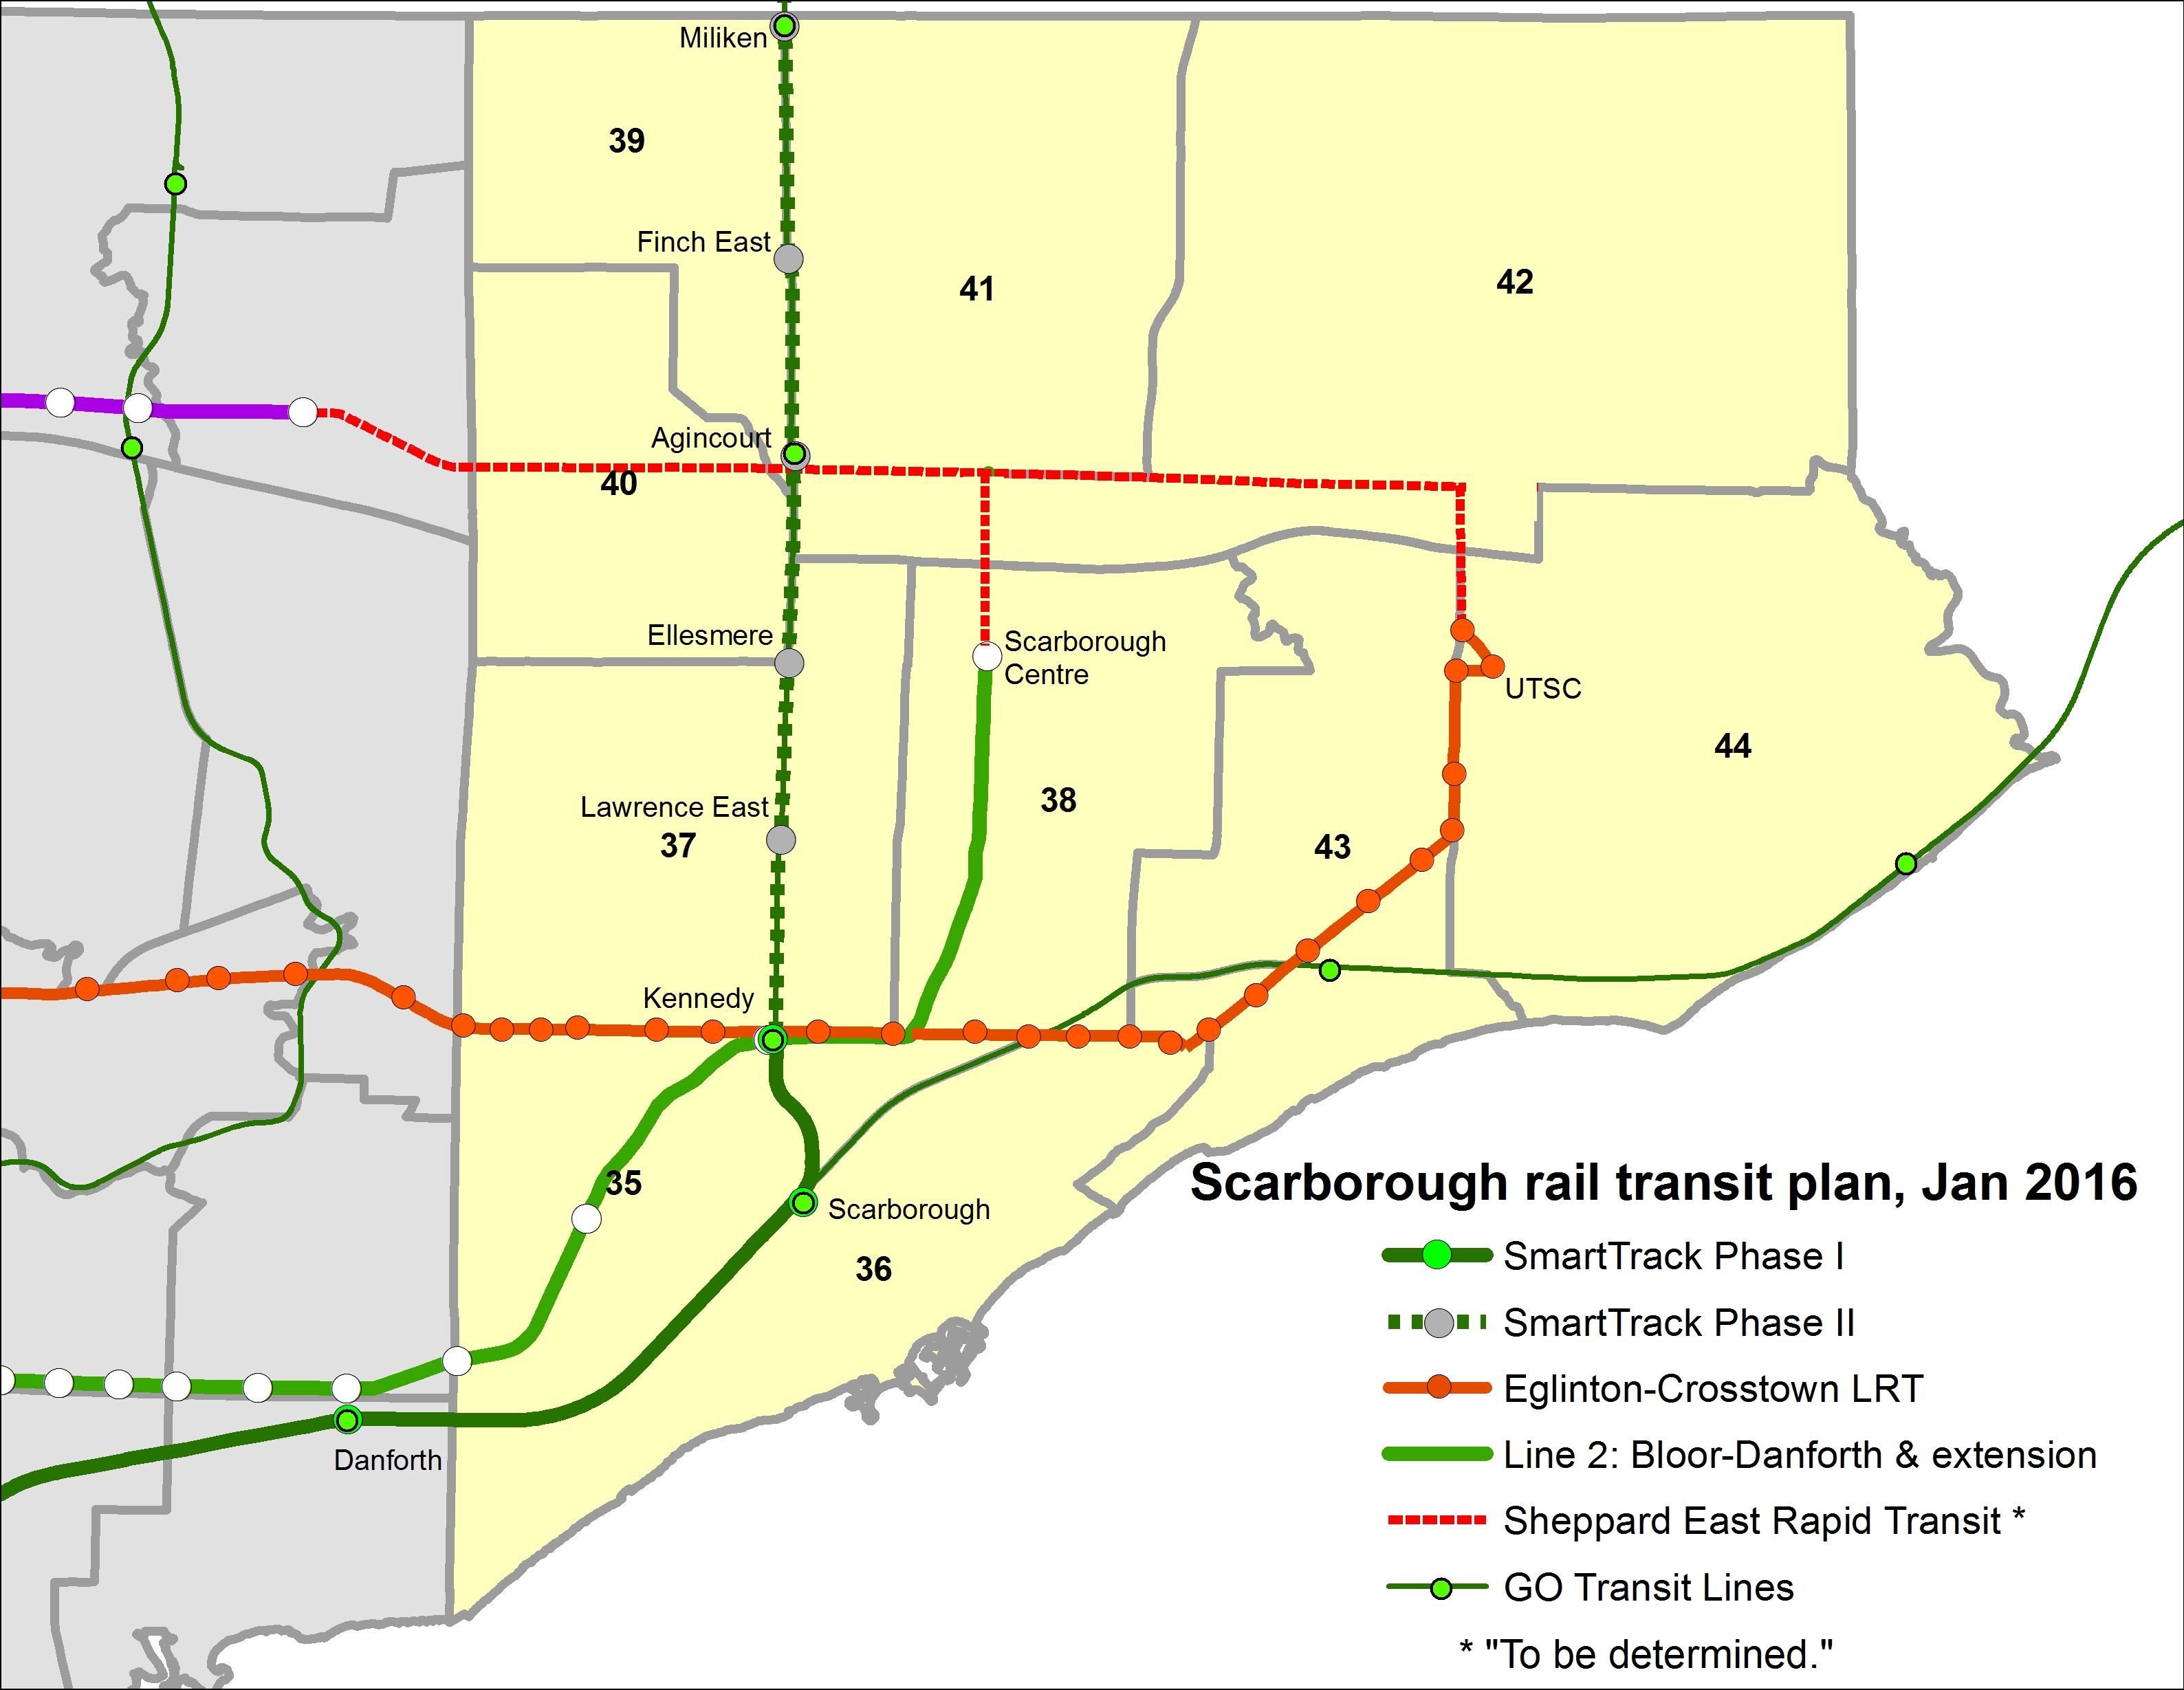
    But there were also some ugly truths concerning that other subway project, the proposed one-stop extension of Subway Line 2 to Scarborough Centre. Last week, homeowners in the Ellesmere/McCowan neighbourhood received notices of possible expropriation, ahead of a public information session in which the preferred alignment of the one-stop subway was revealed. I can understand the residents’ anger; major projects will always be disruptive to some properties and some families and businesses are sometimes forced to re-locate. There’s an argument to be made that subway backers don’t realize the extent of the disruption that even bored-tunnel subways can cause. Stations have to be dug, utilities have to be moved, buildings demolished, and roads closed.

    But most importantly, the Scarborough subway extension remains a bad policy.

    Fullscreen capture 01062016 72046 PM
    2031 ridership projections for terminal subway stations

    In 2031, the projected ridership between Scarborough Centre and Kennedy Station will be 31,000 a day, or 7,200 in the AM Peak. This is lower than previous estimates; a 2013 study estimated the AM peak ridership for the subway extension to be between 9,500 and 14,000. The reduction by nearly half is because the 2013 plan had three stations — at Lawrence, at Scarborough Centre, and at Sheppard — but the new plan has only one station. Passengers on the 54 Lawrence East bus and on the Sheppard corridor would either be gerrymandered to the SmartTrack line, or forced to transfer to get to the subway at Kennedy or Scarborough Centre. $2 billion will be spent for this one-stop extension, while the Islington to Kipling section of Line 1, opened in 1980, cost a small fraction of that amount, even in 2016 dollars.

    On one hand, 7,200 is a respectable peak hour ridership between the two final stations on a long subway line, and subway trains shouldn’t be full at this part of any route. The ridership between Islington and Kipling stations on the other end of Line 2 will be 1,200 less during the same time. Fed by multiple bus routes, Scarborough Centre will be a busy station, one of the top ten for train boardings, if not the top five, in the TTC system.

    But in order to justify John Tory’s SmartTrack, a useful station at Lawrence and McCowan is being dispensed with. Planners, working under the direction council and the mayor’s office, euphemistically call it an “express subway.”

    Scarborough - 2015Scarborough transit plan, 2015

    Scarborough - 2016Scarborough transit plan, 2016

    Previous proposals, backed by former mayor David Miller and 2014 candidates Olivia Chow and David Soknacki, would have seen a light rail line replace the failing Scarborough RT route; the province even promised to cover the capital costs of the retrofit and extension to Centennial College and Sheppard Avenue. In 2011, in a report published by the Pembina Institute, the AM peak ridership of the LRT line between Kennedy and Sheppard was estimated to be 6,400 in 2031, far below the design capacity of a subway extension. An LRT line, with seven stops and many more surface transit connections, would directly serve many more passengers than a one-stop subway.

    Under the failed mayoralty of Rob Ford, the province agreed to build a subway instead, but the city was required to pay up. A property tax levy of 1.6% is currently collected to help pay the city’s share.

    The LRT ship has probably sailed. But thanks to two weak mayors, myopic councillors eager to show they’re fighting for their little fiefdoms, and an obliging provincial government determined not to lose seats in the next election, we’re stuck. At least we’re making progress on the Relief Line.

    Meanwhile, John Tory continues — inadvertently or not — to sow the seeds of confusion over what SmartTrack is all about. After the Downtown Relief Line funding announcement, the mayor put out this tweet:

    This is incorrect. The work on the GO Stouffville Line (not the “Unionville Line”) is a project undertaken by Metrolinx that will allow for two-way service on the existing GO corridor, work that started in 2015. Apart from the SRRA report written before John Tory ran for mayor in 2014, and some initial studies by the City of Toronto and Metrolinx, no work has been carried out on the still-vague proposal.

    Council’s stubborn support of the Scarborough Subway and Tory’s continued SmartTrack fantasies is are just a few reasons why it’s so easy to be frustrated with municipal politics.

  • Open the streetcar doors, TTC

    27244906632_25f4d58e90_o
    4401: A Space Odyssey

    As part of Doors Open Toronto, the Toronto Transit Commission opened up the Leslie Barns for public tours. The new streetcar facility was built to house and maintain the new fleet of Bombardier-built low-floor streetcars. Of course, the streetcar delivery schedule has been disrupted by Bombardier’s incompetence; while there are only eighteen new streetcars currently in revenue service, there should have been 70 in service by the end of last month. Now the Bombardier problems have affected the Region of Waterloo’s light rail project, ION, which was to open in late 2017.

    27309171006_5c7cb17a50_oView from the yard at Leslie Barns west toward the Toronto skyline

    In any case, the TTC always puts on a great public event. Visitors to Leslie Barns were welcomed to tour the vintage streetcars — a 1923 Peter Witt, and a 1951 PCC streetcar. A new streetcar gave visitors a tour through the barns and around the (mostly empty) yard. Employees held a charity barbecue, there were giveaways for children and lots of friendly staff eager to answer questions. These public open houses are where you’ll find the TTC at its very best.

    You could tell that some of the organizers had some fun. The CLRV on display (pictured below) was signed for Old Weston Road, a short turn point on the 512 St. Clair carline. Townsley Loop, once the terminus for Dovercourt and later Harbord Cars, was closed to streetcars in 2003 and the tracks removed during the St. Clair Avenue streetcar right-of-way construction. Streetcar 4401, parked in the paint shop was just asking for the title I gave it, an homage to the visuals in that great Stanley Kubrick film.

    IMG_7410Yeah, operating a streetcar was a childhood dream for a while. Note the rollsign.

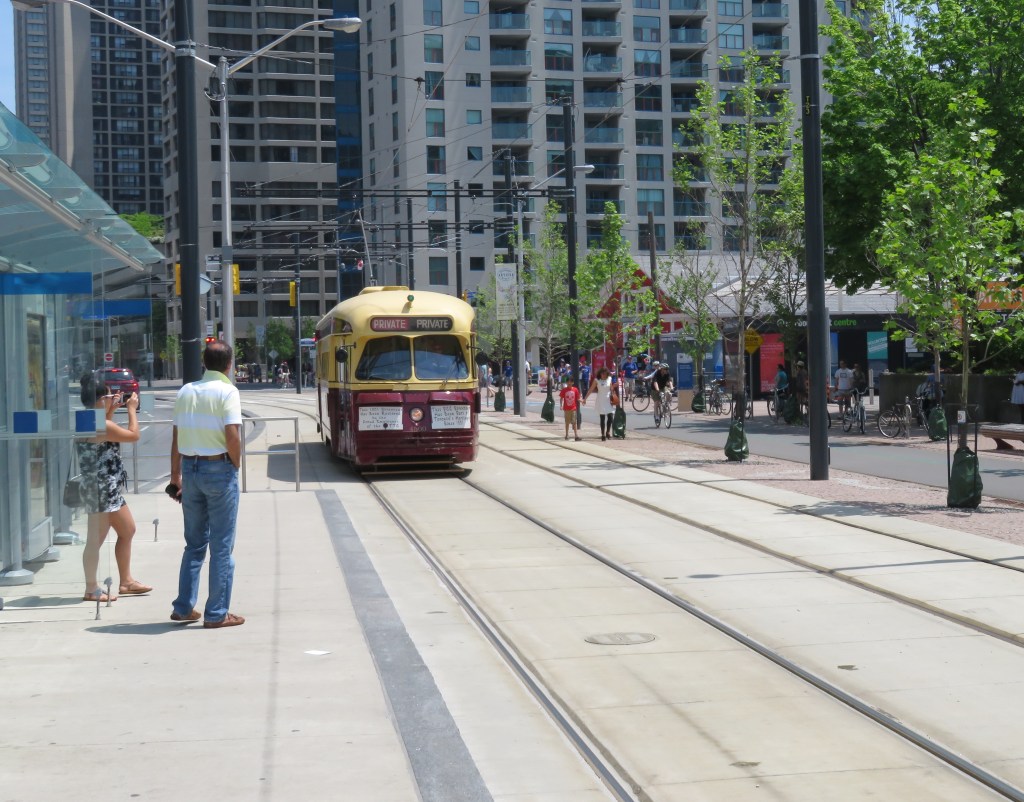
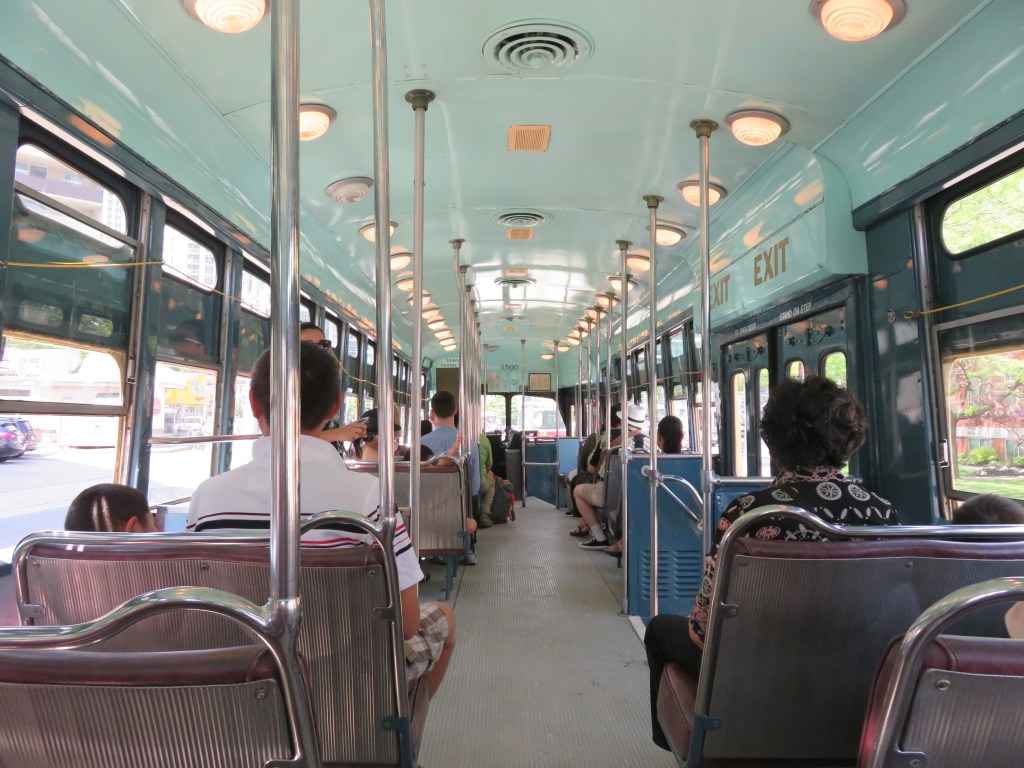
    Also on Sunday (and every Sunday, from noon until 5PM until Labour Day Weekend), you can ride a PCC streetcar in active service along Queen’s Quay between Union Station and Fleet Loop, and rides are free. We did this yesterday between visiting several downtown Doors Open sites, before exploring Fort York. The two PCC streetcars retained by the TTC (the rest were sold to museums or sent to Kenosha, Wisconsin) were restored to their 1951 appearance and are used for special events, charters, and summer Sunday service on the Harbourfront.

    The TTC is often maligned, often unfairly, for poor customer service, service disruptions, and delays. But I think events like Doors Open and free rides on vintage streetcars are a great way for the public to feel good about our transit system.

    IMG_2138Streetcar 4500 on Queen’s Quay

    IMG_2142Interior, PCC streetcar

    PCC Streetcar 4500 at Fleet Loop
    Streetcar 4500 at Fleet Loop, passing the 1861 Queen’s Wharf Lighthouse

  • Leadership, John Tory style (updated)

    Updated May 29

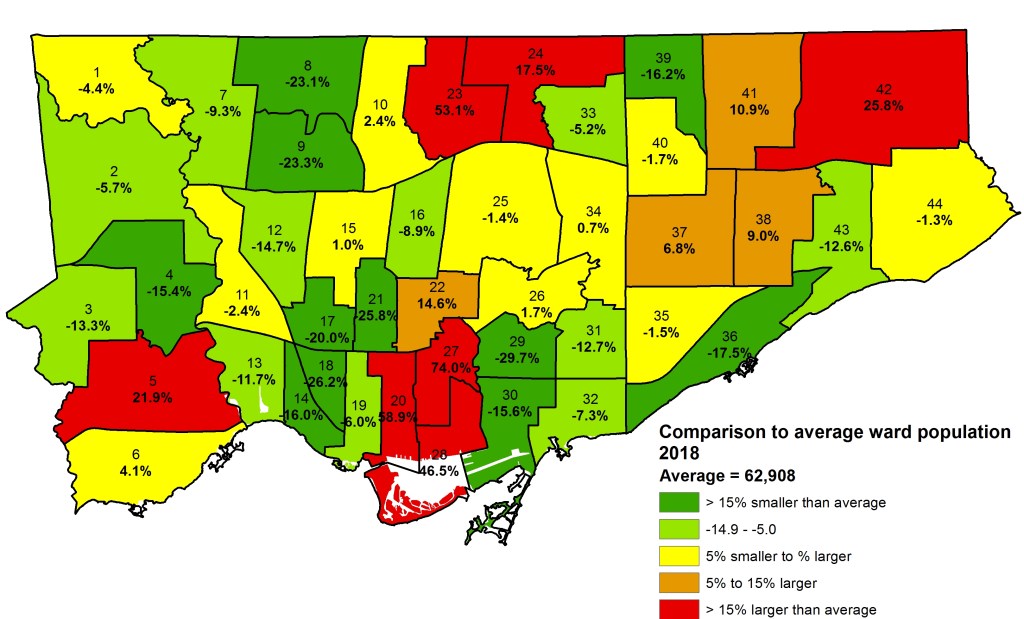
    I was frustrated this week by Mayor John Tory’s pronouncement that he’s “not in favour of adding any more politicians here,” referring to the proposed new ward boundaries released last week that would increase the number of city councillors from 44 to 47. This is despite a rigorous and solid process, with plenty of public and stakeholder consultation sessions. But to Tory, “politician” is a dirty word. Never mind that the boundaries were created in 2000, from even older federal/provincial boundaries that based on the 1991 census, Tory doesn’t like the solution developed after three years of work.

    2014 Election - 2018 Ward Projections
    The discrepancy between each ward’s population and the city-wide average in 2018

    Instead, Mayor Tory wants staff to back to the drawing board and come up with a plan that he likes, following the fine tradition in municipal politics of ignoring the advice and hard work of staff and outside experts because you don’t like the answer they give. Tory’s hand-picked Executive Committee agreed with his motion to defer the debate until the fall. 

    This is a problem. It’s necessary for aspiring candidates to be organizing right now if they want even a slight chance of knocking off an incumbent councillor. For that reason, the boundaries need to be decided as soon as possible. And adding three new councillors really shouldn’t be a big ask — it would cost $870,000 a year, including the costs of hiring additional assistants.

    One reason why Calgary’s Naheed Nenshi is a great mayor is because he trusts his staff and praises their hard work. I was at a lecture in which Mayor Nenshi took very little credit for that city’s response to the 2013 floods. Instead, he spoke about how he. along with senior city staff responded in a coordinated manner, involving all city employees and citizen volunteers in the effort to minimize the flood’s impact and clean up the damage.

    John Tory, on the other hand, shames city staff and local councillor Kristyn Wong-Tam in a crass stunt for Jack Lakey, author of “The Fixer” column in the Toronto Star. This reminds me very much of Rob Ford’s modus operandi.

    In the article, Mayor Tory is photographed cleaning up a planter on Alexander Street, as he explained that he was frustrated by the city bureaucracy who couldn’t get the planter repaired and looking good. Rob Ford was famous for this kind of stunt — filling in potholes, attending to residents’ complaints — often going over the head of councillors or city staffers. Urban forestry manager Dean Hart is named and shamed, but that department does not have responsibility for planters — that’s Transportation Services, which Lakey glosses over. To quote a friend: “so a city division which gets annual budget reductions declines to do work that’s out of scope, and in turn gets this response?” That’s not leadership.

    Leadership means addressing the real problems. Perhaps there is a problem with buck-passing. Maybe there’s a way to improve communications between city departments. A good leader involves the parties responsible and encourages them to find a solution, not publicly shame them. Maybe a leader doesn’t demand annual budget cuts in all areas (except, of course, the police), then blames staff when the effects of the budget cuts become visible. Meanwhile, Ward 27 is the most populated in the city, and Councillor Wong-Tam one of the hardest-working on council. Yet Tory doesn’t want to implement a sensible ward boundary plan.

    Running for election, John Tory liked using the word “bold” a lot, especially when he was touting his signature transit plan, SmartTrack. He promised leadership, but has instead dithered on or deep-sixed important initiatives, like a city-wide cycling network (He won’t back crucial sections of a new city-wide cycling network, saying only that he supports “sensible” bike lanes.

    On police reform, Tory dithered on eliminating the racist practice of carding until forced to take a position when a group of prominent citizens spoke out against it.

    As for social programs and revenue tools to fund essential city services and infrastructure, Tory would rather keep property taxes below inflation, despite the warnings of top bureaucrats. As Desmond Cole points out, Tory is pretty much carrying out Rob Ford’s agenda of low taxes, weak leadership on issues like police reform, and ignoring the plight of Toronto’s poor and lower-income residents. Car owners and homeowners (particularly the owners of single-family dwellings) rule in John Tory’s Toronto.

    Yet, we’ll keep up a needless section of elevated highway. But, at the same time, we can’t build a new streetcar line in the East Waterfront.

    As one person on Twitter pointed out, had we given central Toronto the representation it deserved, Council might have decided to go with the least-expensive Boulevard Option for the eastern section of the Gardiner Expressway. And committees like Public Works and Infrastructure, which has control over items such as cycling infrastructure, are dominated by suburban councillors.


    Bike Routes and Wards
    Cycling infrastructure and Public Works and Infrastructure Committee membership by ward.

    Sure, John Tory won’t embarrass us. He won’t smoke crack, he won’t be caught uttering blatantly racist remarks and he’ll march in the Pride Parade. But he’ll continue the Ford agenda of low taxes and reduced city spending, except for things like the Gardiner East. And it now appears that he will continue Ford’s legacy of crass photo-ops, pretending to care about “customer service.”

    But the city will continue to grow, and we’ll see some progress on important issues, such as inclusionary zoning to build some new affordable housing. There are lots of good people — prominent advocates and people working behind the scenes, staffers and councillors at City Hall, community leaders and great organizations pushing for better — that desire a better city and continue to make Toronto great. There’s plenty of bold leadership for a city that needs it, but you’re not going to find it inside the mayor’s office.

  • Mapping Toronto’s proposed new ward boundaries

    18506683800_6c96dcc66b_k

    Toronto is way overdue for ward boundary reform. Finally, in time for the 2018 election, Toronto will have reshaped ward boundaries — and probably three new wards. This will give quickly-growing Downtown Toronto and North York Centre more representation at City Council.

    Consultants retained by the City of Toronto have been tasked with reviewing the size and shape of Toronto’s wards, and providing a recommendation for new ward boundaries. Back in August 2015, an options report was released with five distinct options. After further consultation, the final report was released yesterday, May 16.

    The final report’s recommendation is similar to the “Minimal Change” option in last August’s options report, but there have been some minor tweaks to the ward boundaries. If the recommendations are approved by City Council, there will be 47 wards, up from 44. Each new ward will have an average population of 61,000, with a range between 51,800 and 72,000 (+/- 15%). These new wards are designed to last for four election cycles, and will be re-drawn again in time for the 2034 election.

    The report will be considered by the Executive Committee on May 24, 2016, which will vote on a recommendation to take to City Council on June 7, 2016. If there are no further hiccups, this gives just over two years for aspiring council candidates and city staff to prepare for the next election, which will be held on Monday, October 22, 2018.

    The recommendation brought forward is a compromise that improves representation in high-growth areas, while minimizing the loss of council representation elsewhere. It increases the number of councillors, but by a minimal amount. (Had Toronto maintained the practice of having two wards per provincial/federal riding, there would be 50 councillors.) Happily, proposals to cut the number of representatives at City Council were not a very popular idea. In terms of staffing and associated costs, each councillor costs approximately $290,000; it would therefore cost about $870,000 to add three new wards, which in my opinion, is a bargain.

    While Downtown Toronto will gain three new seats, and North York gaining one, one seat is lost in Toronto’s west end, in current wards 14, 17, 18. This probably squeezes out Cesar Palacio, a rather poor city councillor who remains in office despite strong competition in the last few elections. Otherwise, despite ward boundary shifts across most of the city, every incumbent councillor should easily find a home that’s mostly made up of their current turf.

    I created the CartoDB interactive map, linked below, for Torontoist; my full article is available there.

    I mapped the results of the 2014 election for every ward in the city — that was the primary reason why I started this blog in November 2014. That previous work should be helpful for predicting the results of the 2018 election with the new boundaries.

    https://seanmarshall1.cartodb.com/viz/5c5c1540-1b21-11e6-8cfa-0ecd1babdde5/map


  • On Toronto’s newest ten-year cycling plan

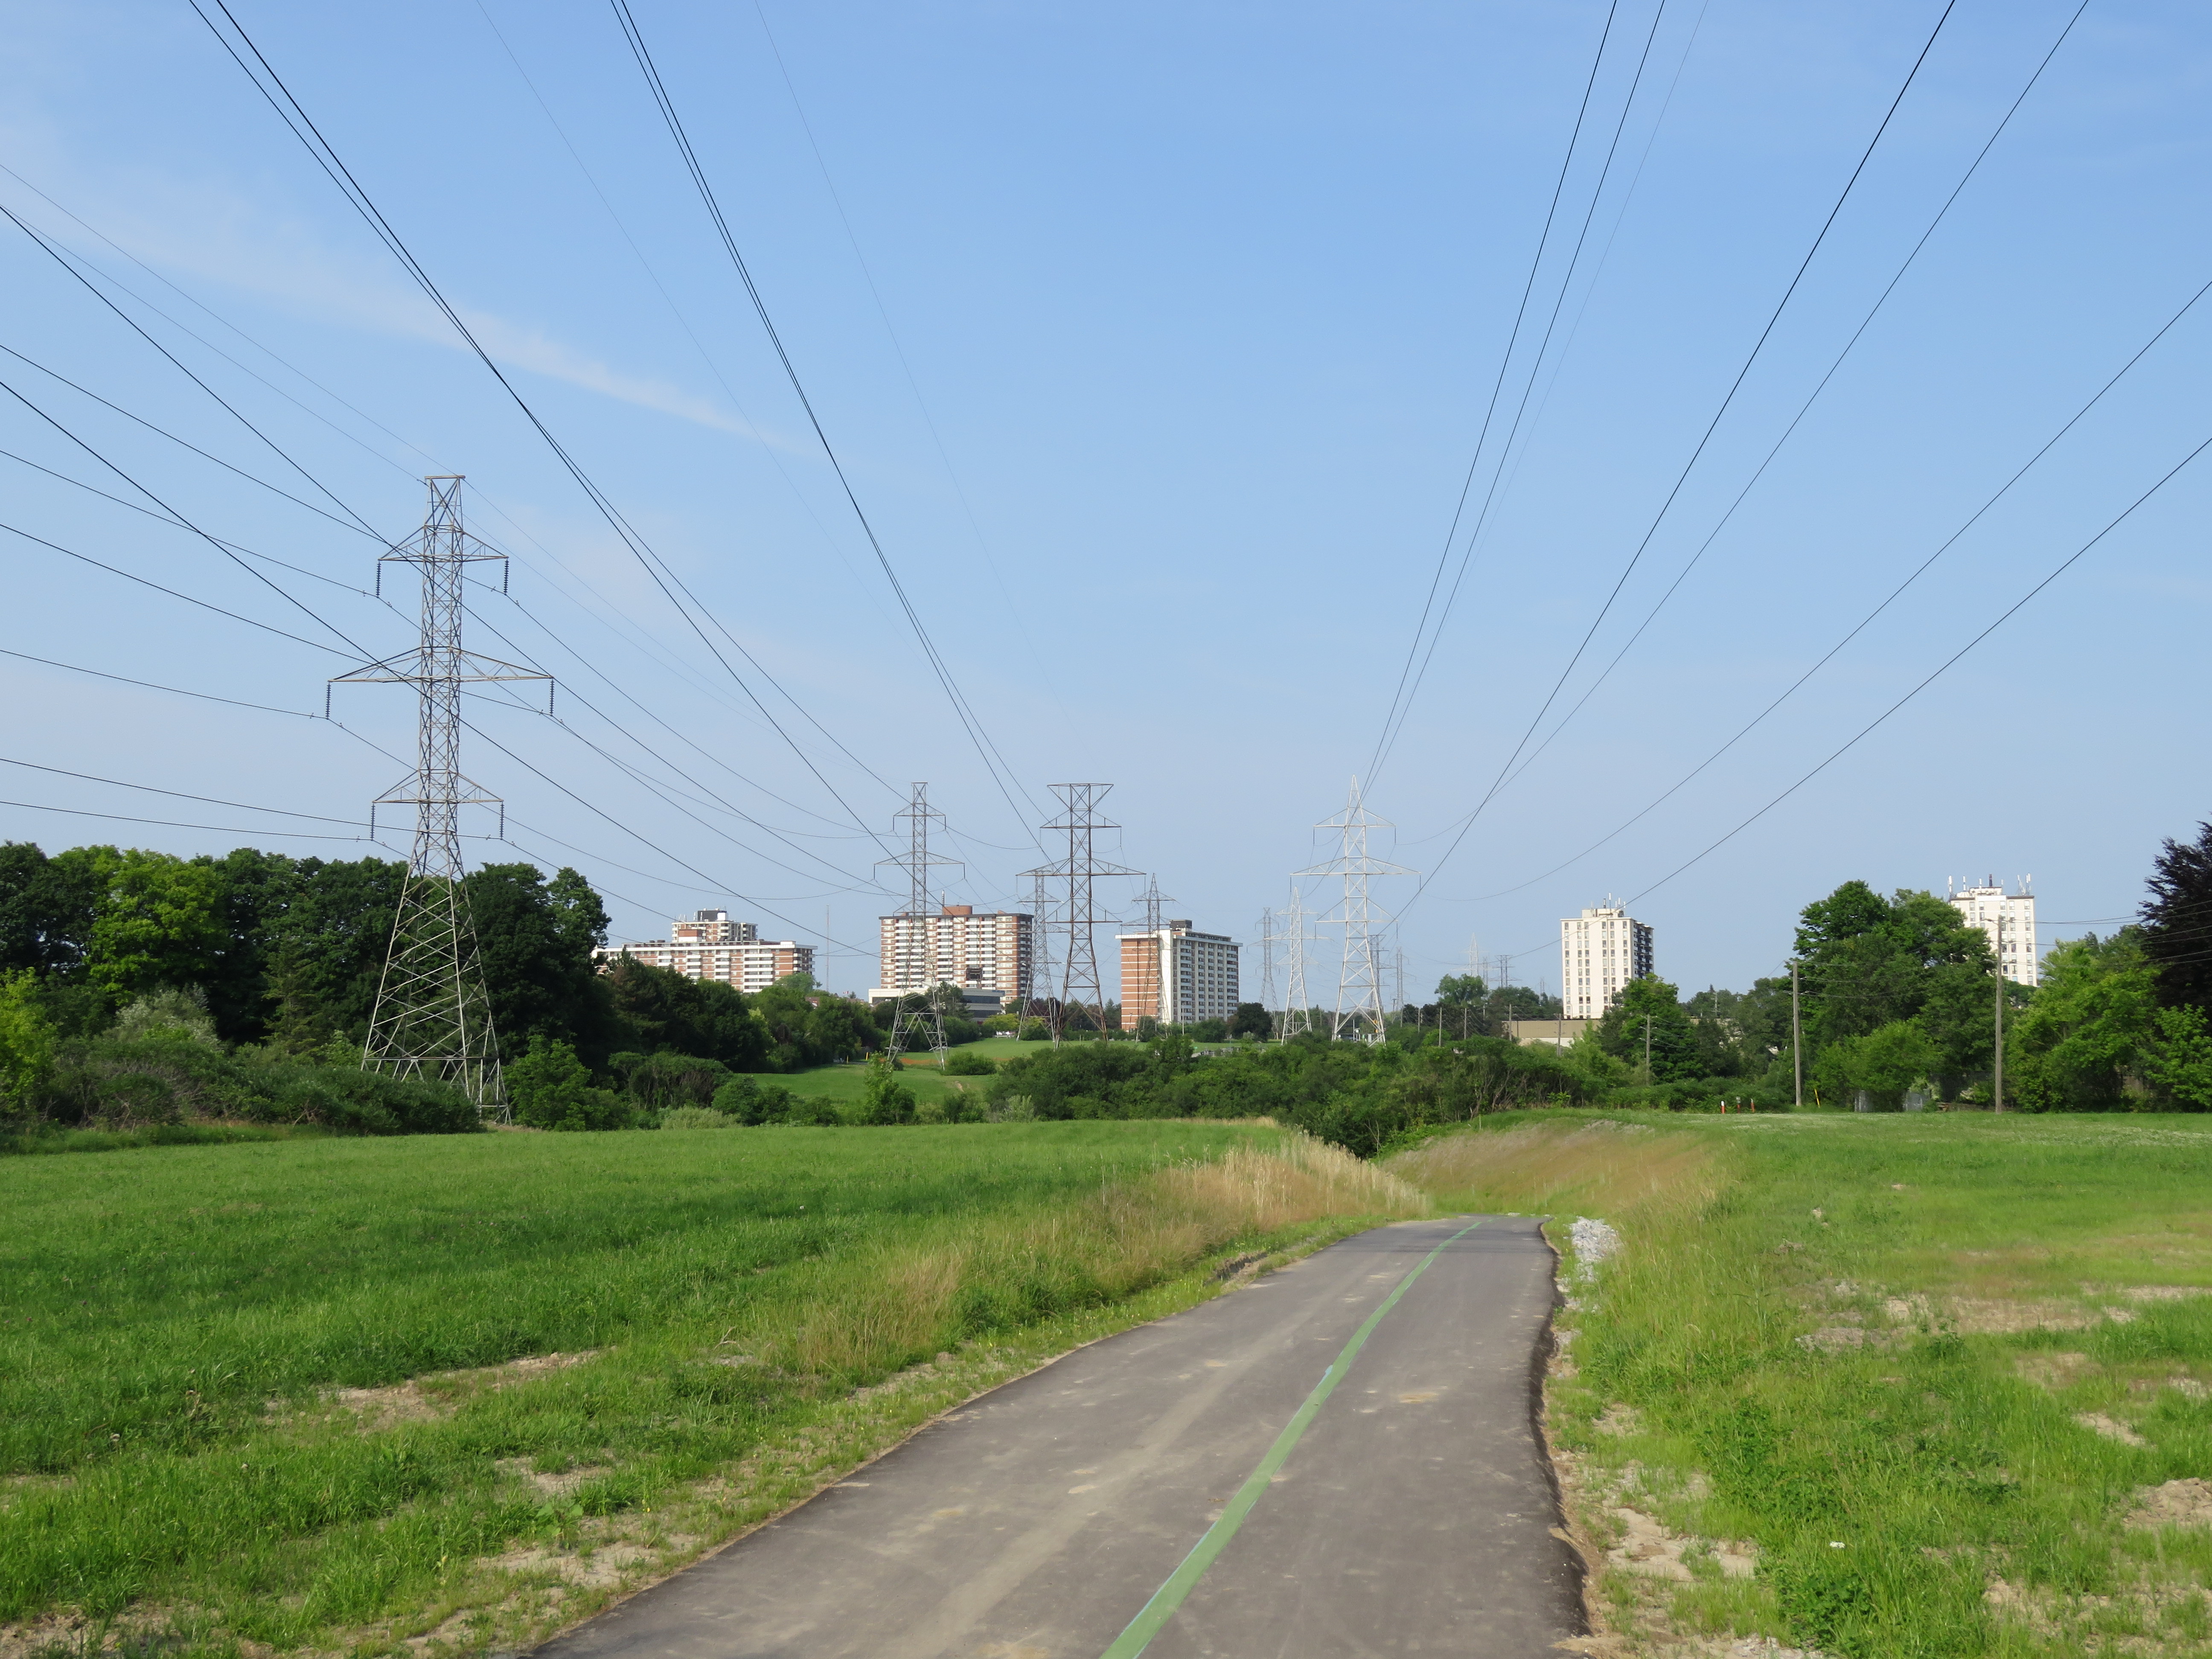
    The newly completed Finch Hydro Corridor
    The Finch Hydro Corridor

    The City of Toronto has released a new proposed Ten Year Cycling Network Plan, which establishes a minimum grid of cycling infrastructure across the entire city. It will be presented to the Public Works and Infrastructure Committee next week; city staff, who have worked long and hard on this project, consulting many stakeholders and members of the public, recommend its adoption by City Council. It will create over 500 kilometres of safer cycling routes, while connecting existing bike lanes and trails to each other. The plan would cost just over $150 million over ten years, a bargain.

    Of course, we’ve been down this road before. Only a fraction of the cycling infrastructure approved in previous plans has been built. And many new trails that were built — following hydro corridors and abandoned railways in suburban parts of the city — don’t connect to nearby ravines and parks. And railways and highways remain major barriers; there are only three places where the city’s designated cycling network crosses Highway 401.

    Last week’s Council approval of the Bloor Street bike lanes between Shaw Street and Avenue Road — a simple pilot project — didn’t look like a sure thing, even though it ended up voting 38-3 in favour.

    Deputy Mayor Denzil Minnan-Wong warned of “bike lane creep,” afraid that a safe bike route would extend to Danforth Avenue (which it should). And Councillor Stephen Holyday (Ward 3, Etobicoke Centre) ridiculously claimed cycling advocates were “trying to build a wall” around the downtown core, ignoring the fact that there’s a subway along the same corridor, which moves many times more people than two lanes of Bloor Street, and there are other options — such as the Gardiner Expressway, which we are needlessly committed to keeping up — for getting downtown with a car.

    Some of the highlights of the new plan:

    • Long distance cycling corridors, such as Bloor/Danforth from Etobicoke to Kingston Road in Scarborough, Kingston Road from the Beaches to West Hill, and Yonge Street from Downtown to Steeles Avenue.
    • New connections across railways, ravines and highways.
    • Extensions to popular off-road trails, such as the West Toronto Railpath.

    Highways are very dangerous for pedestrians and cyclists to cross: high-speed ramps are marked with signs telling pedestrians to wait for gaps. Cyclists must navigate cars quickly changing lanes and exiting freeways. And railways can create long, impenetrable barriers unless pedestrians trespass on railway property. I wrote about it at more length in Spacing.

    The worst example might be where Bridgeland Road ends on one side of the Metrolinx-owned Newmarket Subdivision (GO Transit’s Barrie Line) and Floral Parkway ends on the other side. Highway 401 conspires to make this an exceptionally bad case. Happily, this is one of the places where the city seeks to build a new bridge or tunnel to allow cyclists and pedestrians to cross safely, and I am glad to see other gaps addressed in this latest plan.


    An example of how railways and highways create barriers to active transporation

    There are four large maps (large PDF files) that show the existing cycling network and the proposed new routes. They correspond to the four community council boundaries.

    Toronto and East York
    North York
    Etobicoke-York
    Scarborough

    It’s not only important that City Council approve this new plan, it’s also crucial that proponents of active transportation keep on top of the city to actually build the new cycling infrastructure and multi-use paths and bridges. We’ve seen this play out before: council approves a great plan for cycling, for transit, for urban development, and then rests on its laurels. Let’s do better this time around.

  • The TTC’s disappearing parking lots: why this isn’t a bad thing

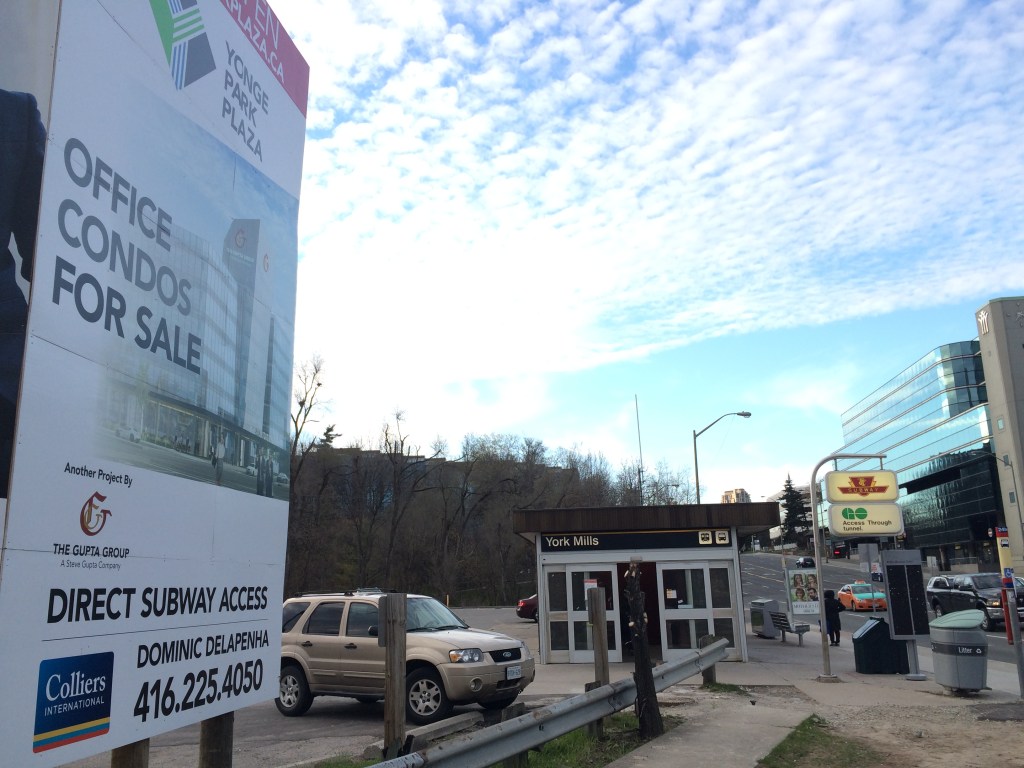
    IMG_6376New office development at the TTC York Mills Station parking lot
    I’ve written several times on my blog about GO Transit’s problems with free parking. The Toronto Transit Commission (TTC) also operates many parking lots — 11,000 parking spots located at 13 of its 69 subway and RT stations — but has declared many of its lots surplus to its needs. Right now, the City of Toronto’s real estate arm, Build Toronto, is in the process of selling or leasing TTC lots for residential and commercial redevelopment. The TTC, unlike GO Transit, charges for parking at all lots, and it isn’t in a hurry to build more. For the TTC, redeveloping parking lots raise money (which, in the TTC’s case, goes to the city) while they generate additional ridership.

    There’s a difference between TTC subway stations and GO Transit stations, to be sure. The TTC relies mostly on buses and streetcars, as well as walk-up traffic, to feed its rail system, while GO Transit relies mostly on suburban commuters driving to its stations. They are different models. But in urban areas like Downtown Brampton, I believe GO Transit should be much more innovative than deciding to rip down a city block to build yet another “free” surface parking lot.

    GO Transit should rethink their model, encouraging more walk-up and local transit connections as it transforms into a regional rail system. Redeveloping some of its lots is a good way to go; commuter parking garages can easily be integrated into new urban uses and make their stations more attractive places to walk and cycle.

    I have more to say about the TTC’s parking lot crunch over at Torontoist.

  • The many challenges of creating a transit hub at Pearson Airport

    7afe7e75-d368-4472-b208-ab02c57457aa-001
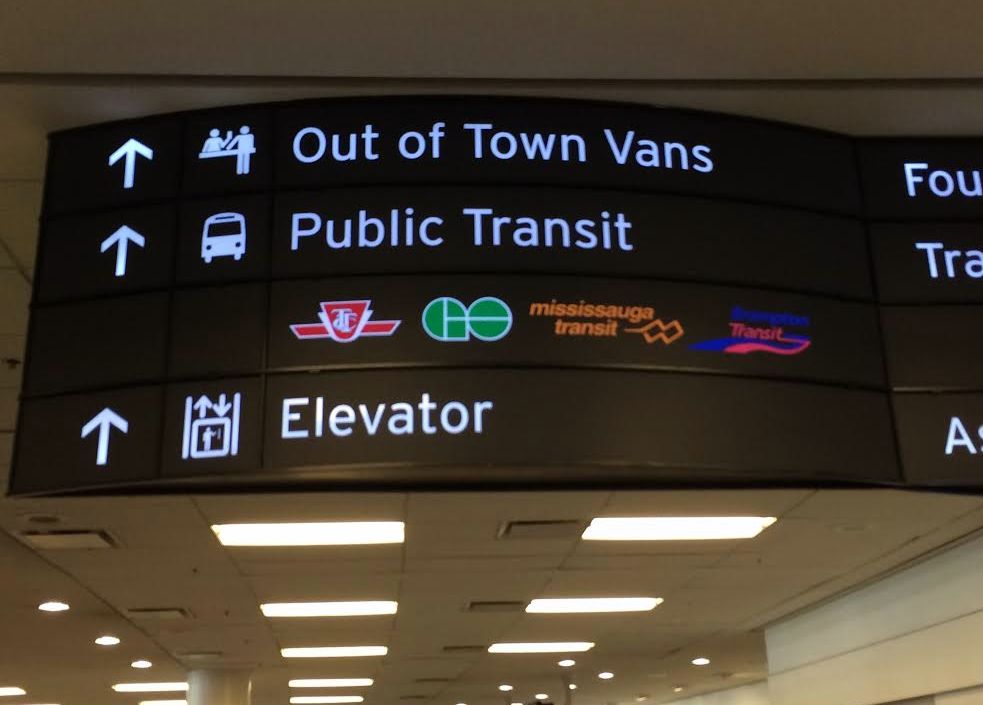
    Sign in Terminal 1 at Pearson Airport. Whether we realize it or not, Pearson Airport is already a transit hub. 

    Updated April 7, 2016

    Lester B. Pearson International Airport is Canada’s busiest airport, handling 41 million passengers a year. It is not the busiest transportation hub in the Greater Toronto Area, though; Union Station is considerably busier (GO Transit alone handles 64.4 million passengers a year at Canada’s busiest station).

    Pearson Airport is located almost entirely within the City of Mississauga, but the terminals are less than a kilometre away fromthe City of Toronto’s western boundary; due to the location of the airport terminals, most passengers reaching the airport by road, or transit pass through the City of Toronto to get to it.

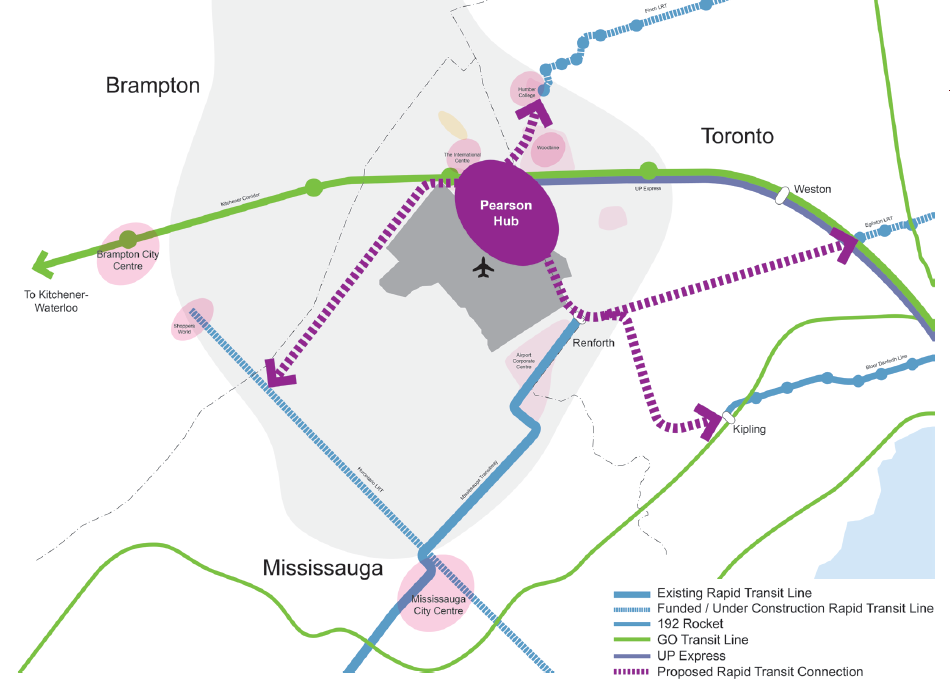
    The Greater Toronto Airports Authority (GTAA), the not-for-profit agency that operates Canada’s busiest airport, has expressed interest in creating a transit hub and guiding transit-oriented development around it. It’s an interesting idea, and some of the facts are compelling.

    There are approximately 300,000 jobs located at and near Pearson Airport. The airport itself hosts 40,000 employees that work for the airport authority and its contractors and tenants, including retailers, airlines, and allied services. The remaining 250,000 jobs are located in office parks and industrial areas that surround the airport, in the cities of Toronto, Mississauga, and Brampton, a very large area that extends north into Bramalea, west of Hurontario Street and south to Highway 403.

    You can read the GTAA’s report, written by the prestigious planning firm Urban Strategies Inc., and named Pearson Connects: A Multi-Modal Platform for Prosperity online as a PDF. The report claims that Pearson Airport and environs has more jobs, and more economic clout than any Canadian downtown, with the exception of Downtown Toronto. To a degree, this is true. But the size of the Airport Employment Zone, as the GTAA defines it, is much larger in size than any downtown, even Toronto’s; the jobs are mostly dispersed in warehouses, factories, and suburban office buildings difficult to reach by transit.

    In fact, Pearson Airport and its surrounding area — all 25,600 hectares  (256 square kilometres) — has fewer than 25 employees per hectare, while Downtown Toronto, one-tenth the size, has nearly 200 employees per hectare (and a growing residential population as well). Igor Dragovic calculated these figures from a recent Neptis report. The low employment densities found in business parks and warehouse districts are only partly to blame; the airport itself, with five active runways and a large land buffer, contributes to this.


    The GTAA wants to build an “airport-related multi-modal hub” that would tie together existing and planned rapid transit services, including the Kitchener RER Service, LRTs on Eglinton and Finch Avenues, the Mississauga Transitway BRT and a proposed Derry Road transit corridor.  It cites airports in Amsterdam, Frankfurt, London, and Hong Kong as examples to emulate.

    GTAA ProposedThe GTAA’s proposal for a transit hub, taken from Page 7 of the report

    The report also neglects to recognize that Pearson Airport is already a major transit hub; the problems lie in integrating the existing and proposed transit services together. And for an area the size of the GTAA’s Airport Employment Zone, that’s a very tall order.

    (more…)

  • On transit ridership in the GTHA

    Earlier this week, the Toronto Transit Commission (TTC) released its agenda for the next board meeting, to be held on March 23. Among the items to be discussed are updates on the delayed Line 1 subway extension to York University and Vaughan, plans for the Line 2 subway extension to Scarborough Centre, the new MiWay/GO Transit terminal at Kipling Station, the planned new 514 Cherry streetcar line and other Waterfront bus improvements, and a ridership update.

    As always, Steve Munro is on top of it all, and I encourage you to read his post.

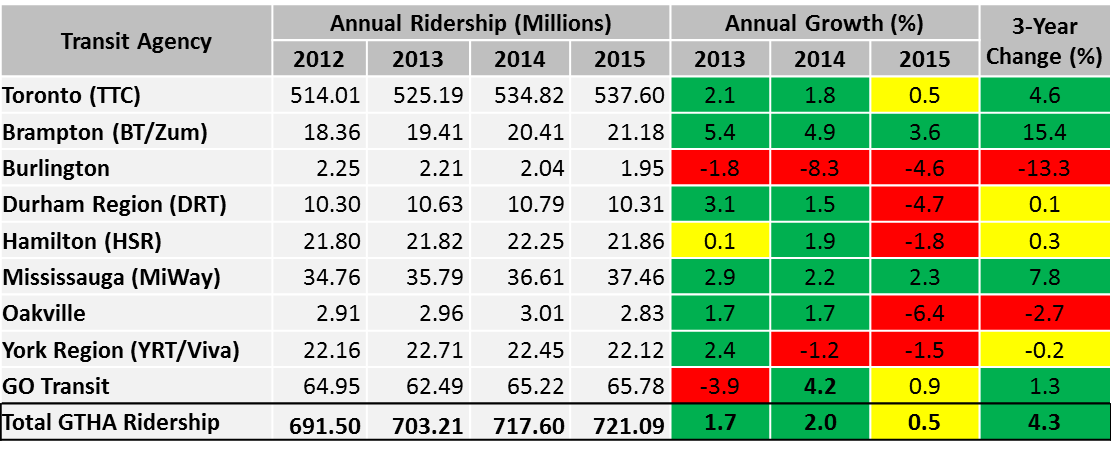
    I wanted to make a few observations about ridership, especially in Toronto’s suburbs. Growth in the TTC’s ridership has slowed down in the last three years, from a 2.1% annual increase in 2013, to a much more modest 0.5% increase in 2015.

    Ridership figures are not detailed enough to know at what times of the day ridership is changing, nor on what routes. But ridership growth has fallen (or even declined) for other major Canadian transit systems, including Vancouver, Montreal, and Ottawa. There are many causes for changes to ridership — population and employment growth or decline, fare increases, service improvements or cuts, even the cost of gas, which has been declining in the last two years. Much of the employment growth within the City of Toronto has been in the downtown core, but so has the population growth due to new residential highrises. (I’m one of thousands who live and work in or near the downtown core — my TTC use is now mostly during the evenings and weekends as I mostly walk to work).

    Hopefully, the Commission and the city don’t use this short-term trend as  an excuse to hold back on needed service improvements or projects such as the Relief Line — for one thing, many buses, streetcars and subway trains are already overcapacity, and it is impossible to know whether slower ridership increases represent a long-term trend, or a short-term blip.

    There was one table in the TTC ridership update that caught my attention. The table, on page 5, shows the ridership for every Greater Toronto and Hamilton Area transit system (though excluding Milton Transit). I reproduced that table below.

    Ridership

    GTHA transit agency annual growth rates, 2013 to 2015. Adapted from TTC 2016 Ridership Update, page 5.

    While the TTC’s ridership growth has slowed, ridership in many suburban municipalities have either flatlined or declined. Only Mississauga and Brampton show consistent, positive growth over the last three years. MiWay, previously known as Mississauga Transit, hasn’t expanded transit operations that much in the last few years, but that city continues to enjoy modest employment growth and improved connections to the airport, Brampton Transit and the TTC. It is currently building a new bus rapid transit (BRT) line, the Mississauga Transitway (more on that in a later post), and city council is backing the Hurontario LRT line, which would largely replace bus service on its busiest corridor.

    Brampton’s growth has been, by far, the most impressive. That suburban municipality is growing thanks mostly due to new sprawling subdivisions, but since in the last decade, Brampton Transit has been introducing annual system improvements, including the Zum “BRT-lite” network of limited-stop bus routes. Brampton’s ridership is now almost that of the Hamilton Street Railway (HSR). Unlike Hamilton, Brampton doesn’t have two major post-secondary educational institutions, nor a dense urban core, though it serves Humber College, York University, and two secondary Sheridan College campuses in Brampton and Misssissauga.

    In Hamilton, ridership dropped by 1.8% in 2015. Most ridership in Hamilton is concentrated in the lower city, as well as a few trip generators in the suburbs, including Mohawk Collage on the Mountain, and Lime Ridge Mall. Many parts of the lower city have been hit hard by job losses in that city’s major industries, though new subdivisions (and, to a lesser extent, downtown gentrificaton) have contributed to modest population growth. Hamilton is going ahead with a provincially-funded east-west light rail line that will connect McMaster University, Downtown Hamilton, and the east end.

    Elsewhere, transit ridership growth has been quite disappointing. Burlington Transit saw a drastic 13.3% decline over the last three years, Durham Region, which I recently visited, saw a major decrease in 2015. However, there is lots of promise in its five-year service strategies, which will improve and simplify the agency’s route structure and provide enhanced service.

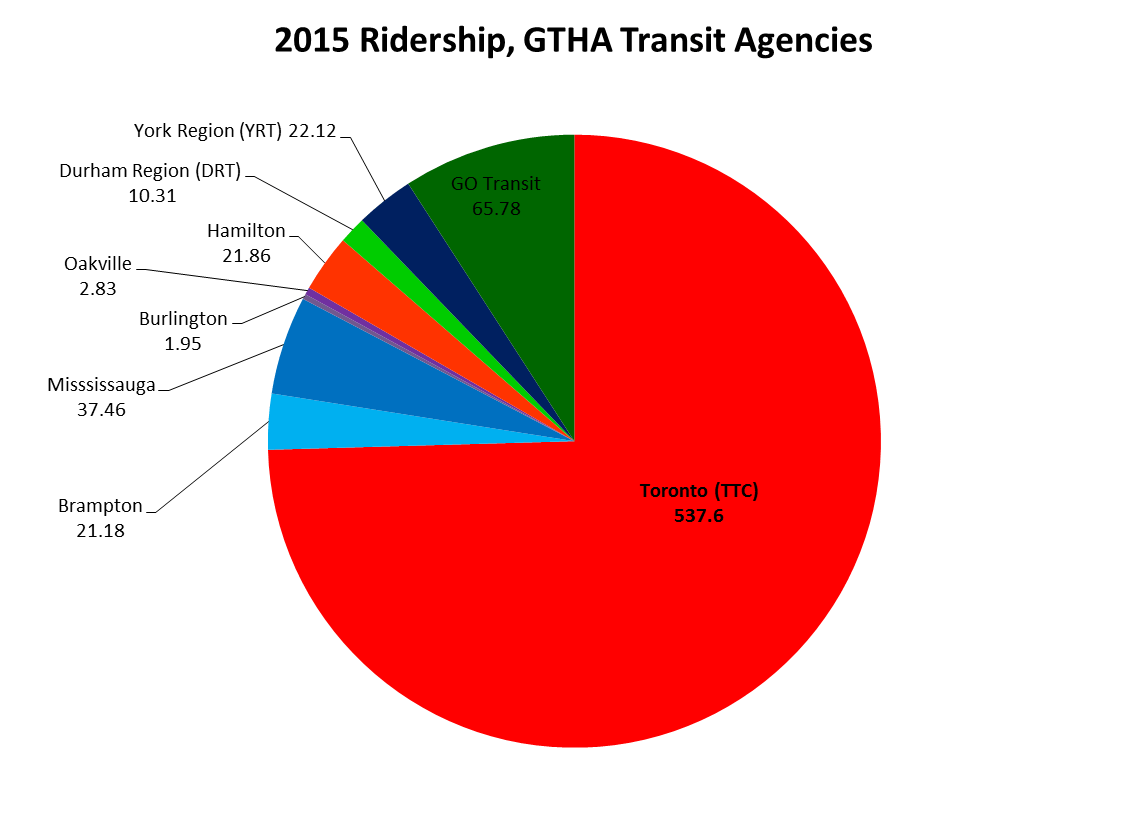
    2015 Ridership
    2015 ridership for GTHA transit agencies (Milton excluded). The TTC, with narly 75% of the region’s ridership total, dominates. GO Transit holds another 9%. 

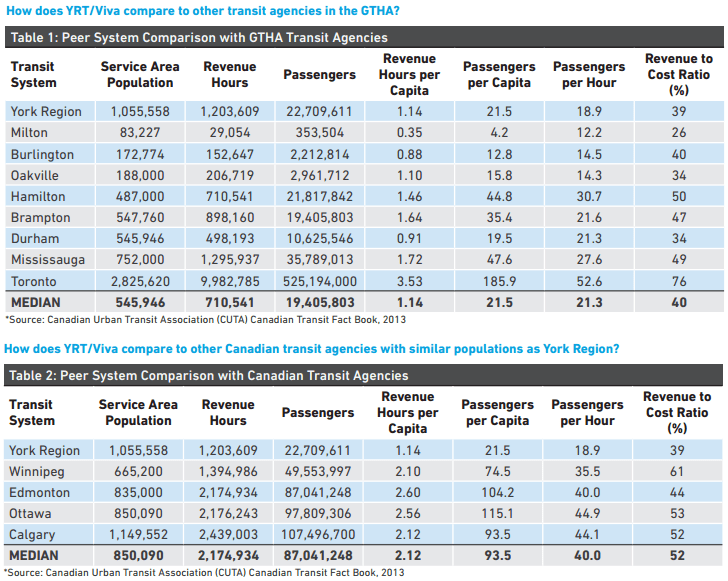
    York Region Transit, serving a population of 1.2 million, has only 1 million annual riders more than Brampton, whose population is nearly half of York’s. And despite adding new subdivisions (and a few new residential towers), ridership declined in the last two years. As illustrated in the table below, YRT’s ridership per capita is less than half of Hamilton’s or Mississauga’s.

    YRT Ridership StatsComparing York Region Transit to other Canadian transit systems, 2013. From the VRT/Viva 5 year service plan, page 7. 

    It’s interesting that despite poor transit ridership (amid York Region Council-mandated service cuts and steep fare hikes) York Region, with senior government assistance, is spending $1.4 billion on dedicated median busways on Highway 7, Yonge Street and Davis Drive. York Region will get the Spadina subway extension in 2017, and it pines for an extension of the over-burdened Yonge Subway to Richmond Hill Centre.

    In York Region, there’s a troubling disconnect between spending money on capital projects and funding the services that will use the shiny new infrastructure, or feed ridership to it. Brampton has proven that growing service, not necessarily fancy infrastructure, will grow ridership. That said, it remains disappointing that the suburban municipality with the best record for ridership growth in the Toronto region rejected a funded light rail transit line to its downtown core.

  • Where the sidewalk ends in Toronto (Updated)


    IMG_3357
    McNicoll Avenue at Boxdene Avenue. There’s no sidewalk on the south side of this busy Scarborough road.

    Update: I posted a revised and updated version of the map and article on Spacing Toronto. There, I mention a new absurdity in the war on sidewalks: on Glen Scarlett Road, near the old Stockyards in Toronto’s Junction neighbourhood, the city is proposing  a new sidewalk for 2016 as part of a road reconstruction project.

    The local councillor, Frances Nunziata, is siding with local industry in opposing a sidewalk. Local industries — including slaughterhouses and warehouses — oppose a sidewalk as it would cross their loading docks; Nunziata’s office claims that since the street “is unsafe for pedestrians to be walking on due to heavy traffic, [the City] should not be encouraging pedestrians to use this road by installing a sidewalk.”

    This logic is completely counter-intuitive. It ignores the needs of workers walking to work, and local residents walking to the streetcar loop at St. Clair Avenue and Gunns Road, or to nearby shopping and residential areas.


    There was a very interesting interview on CBC Radio’s Metro Morning on Tuesday, February 16). Host Matt Galloway spoke with Fiona Chapman, the City of Toronto’s manager of pedestrian projects, on missing sidewalks. Nearly one-quarter of all local streets in Toronto don’t have a sidewalk; many more only have a sidewalk on one side of the street. Chapman was discussing a presentation to the City’s Disability, Access, Inclusion and Advisory Committee on staff recommendations that would seek to fix this problem.

    CityData - SidewalksStatic map showing the City of Toronto’s sidewalk inventory as of 2011.

    Most local streets that don’t have sidewalks are found outside the old Cities of Toronto, East York and York, particularly in parts of Etobicoke, North York and Scarborough built in the 1950s and 1960s. Some of these residential and industrial streets were built with ditches instead of storm drains; others were laid out without sidewalks in mind. In the master-planned Don Mills development, there are many walkways connecting parks, major roads, and schools; it was likely intended that these would be used for getting around on foot rather than sidewalks. In other post-war subdivisions, particularly affluent areas like those in central Etobicoke, it was probably assumed that everyone would get around by car.

    The City of Toronto is hoping to change this. As roads come up for reconstruction, the new policy, recommended by staff, is to install a sidewalk where there isn’t one already, even despite local opposition. The current policy, in place since 2002, is that a new sidewalk could only be installed on an existing local street after the local councillor completed a consult of the neighbourhood and there was a consensus supporting the installation.

    In Toronto, the installation of new sidewalks has been surprisingly controversial. But the city’s presentation lists some of the reasons why sidewalks are often opposed. Sidewalks have to be cleared by the adjoining landowner. Residents can’t park their cars in the driveway if they block the sidewalk. They might result in the removal of landscaping or trees. And there is a minority who just want to keep outsiders out of their neighbourhoods. You could call this NIMBY-ism, even though sidewalks are technically is in the front yards, not the backyards, of local opponents.

    Sidewalks provide safe, accessible routes for pedestrians, especially important for people using strollers or mobility devices. They promote the city’s initiatives encouraging children to walk to school, for all persons to engage in physical activity, and for seniors to age at home. City policy, including the Toronto Pedestrian Charter, supports sidewalks.

    On Chine Drive, in an affluent part of Scarborough near the Bluffs, local residents opposed the construction of a sidewalk, even though it would provide a safe path to a nearby school. Since 2004, some residents opposed the sidewalk, claiming that they were afraid it would “take away from the rustic look of the neighbourhood.” Supporters, including parents with young children, wanted a safe route to the local school. It took ten years, but in 2014, the sidewalk was installed.

    Last year, on nearby Midland Avenue South, there was a similar fight to keep sidewalks off of that street. This is despite the fact this section of Midland Avenue is designated as a collector road, and is part of the Waterfront Trail’s route in the Scarborough Bluffs area. The city owns the land, known as a boulevard, where the sidewalks would go, but without the consent of local homeowners, the city was left in a bind. This new city policy will hopefully solve this problem.

    Below, I created an interactive map of the City of Toronto’s sidewalk inventory, created with data from the City of Toronto’s Open Data Initiative. It shows each public street in the city of Toronto (excluding private roads and laneways), as of 2011. I made a few edits, such as including the new Chine Drive sidewalk, and correcting a few errors that I was aware of.

    Almost every arterial and collector road in Toronto has a sidewalk on at least one side of the street. Exceptions include Highway 27 and Black Creek Drive, where, like expressways, pedestrians and cyclists are prohibited, the Bayview Drive Extension though the Don Valley, and in the far northeastern part of Scarborough, in Rouge Park. But it’s the local streets, marked in orange and red that are most apparent.

    https://seanmarshall1.cartodb.com/viz/3f206014-d4f2-11e5-b47b-0e787de82d45/public_map


    Providing safe, accessible, and consistent pedestrian infrastructure is simply the right thing to do. The city owns the land on which sidewalks can be put down, if they aren’t already. There are legitimate concerns that need to be taken into account when new sidewalks are proposed — trees and landscaping especially — but at the end of the day, the needs of vulnerable road users need to be addressed first and foremost.

  • Tunnel Vision: A History of Toronto’s Subway

    IMG_0209-001

    If you haven’t yet had a chance to go, you should be sure to visit the Market Gallery at St. Lawrence Market. The current exhibition, called Tunnel Vision: The Story of Toronto’s Subway, is a fascinating collection of maps, photographs, memorabilia, and drawings illustrating over a century of subway plans and operations in Toronto. Dominating the gallery, which was the City of Toronto Council Chambers in the 19th century, is the front of an H-4 subway car; visitors are encouraged to take selfies with it.

    While Canada’s first subway opened in 1954, there were serious subway proposals that date back to 1910. Interestingly, many of these early subway maps feature a line that looks very similar to the (Downtown) Relief Line.

    I wrote more about this exhibition, which continues until June 11, 2016, in Torontoist