Tag: Toronto

  • Signs of the times

    Signs of the times

    IMG_8110
    Electronic sign on the Don Valley Parkway

    I had access to a car yesterday, so I drove to a suburban supermarket to stock up on some large and bulky items we needed — things such as laundry detergent — to get through the next few weeks of physical distancing. Normally, I’ll walk to the nearest supermarket, only a few minutes away, but this way, I could get a lot done at once.

    Though many shelves remain empty (pasta, rice, paper towels, and toilet paper remain in short supply), and cashier lines long (with tape marking where customers should wait, minimizing close contact), the mood remains friendly and polite among shoppers and staff alike. This is certainly a bright point in these difficult times.

    IMG_6324Empty shelves at the supermarket

    While running these essential errands, I took a GoPro camera, and mounted it to the front of the dashboard. It made for a very interesting view of the Gardiner Expressway at mid-morning, when the elevated highway is usually congested. When built, the Gardiner passed by rail yards, factories, and warehouses, south of the Downtown Core. Now the roadway runs between tall office and residential towers, with more being built all the time.

    When it’s free-flowing, the Gardiner makes for a visually fascinating drive.

  • A week of social distancing in Toronto

    A week of social distancing in Toronto

    Overlooking Eaton Centre, March 19 2020

    Ten days ago, I spent the day at City Hall and addressed the Infrastructure and Environment Committee. While I was following news of a novel coronavirus that was affecting China, Italy, and Iran, it wasn’t on my mind that day.

    What a difference a few days makes.

    On Thursday, the province announced that elementary and high schools would close for a three-week-long March Break in an effort to contain an outbreak here. One by one, universities and colleges cancelled in-class lessons, with instructors having to move the remainder of their classes online. The World Health Organization declared COVID-19 a pandemic. Travel restrictions came into place. Restaurants were asked, then forced, to close for dine-in guests. Theatres, cinemas, and some retail chains followed suit. Most office workers were now working from home. Libraries, recreation centres, and even outdoor skating rinks were all shut down.

    By Monday, March 16, the city was quiet.

    My spouse and I live in an apartment downtown, without a car, so we’ve been going on short walks in the neighbourhood, careful to keep our distance from others (this has been tough to do in supermarkets as I pick up essential food and supplies). But I find the walks are necessary for my mental well-being. They’re also surreal.

    Though most stores in the Eaton Centre were open on Monday (Apple and Nike were among the first to voluntarily close all their retail stores), by Tuesday, nearly half were closed. On Thursday, only a handful were open, including, controversially, EB Games.)

    The last time I saw the mall so empty during daytime hours, was walking back towards Union Station to go home from Ryerson University on the afternoon of September 11, 2001.

    Eaton Centre March 19 2020
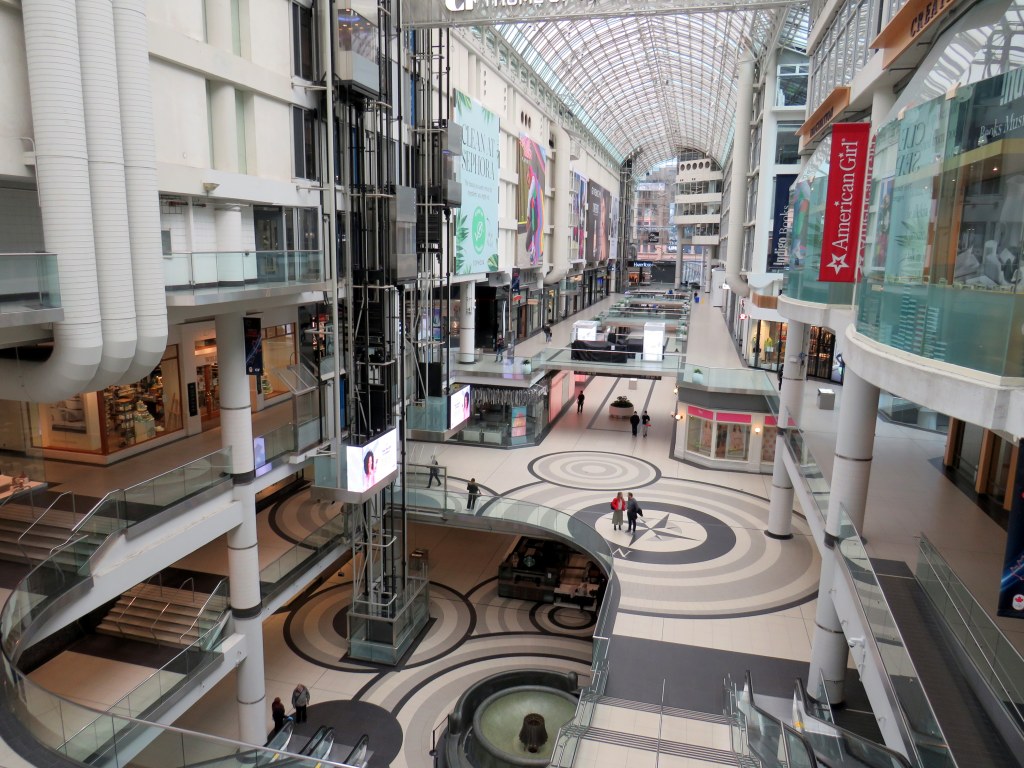
Keeping distance inside Eaton Centre, Thursday, March 19, 2020

    As a condition for permitting the mall’s construction in the 1970s, the City of Toronto required permanent, twenty-four hour public access along the corridor between Shuter Street and James Street, behind Old City Hall. This concession was made because the new mall required several east-west public streets to be closed between Queen and Dundas Streets.

    As a matter of practice, most of the mall’s corridors remain open during all hours, providing access to local streets and two subway stations. The only time I encountered locked doors was during the 2010 G-20 Summit fiasco.

    York Concourse, March 16 2020GO Transit’s York Concourse at Union Station during the afternoon rush hour on Monday, March 16

    Meanwhile, other busy public spaces, such as the GO Transit concourse at Union Station were also eerily quiet. While it is good that most are able to heed the calls from public health officials and political leaders to stay home where possible, I hope that we can continue to build transit, and not enter another lost decade of service cuts and ignoring needs for more infrastructure.

    Busy streets, like Bloor and Queen, are also quiet. With no where to go, there’s very little traffic.

    "Hug Me" Queen Street West, March 19 2020The “Hug Me Tree” on Queen Street West
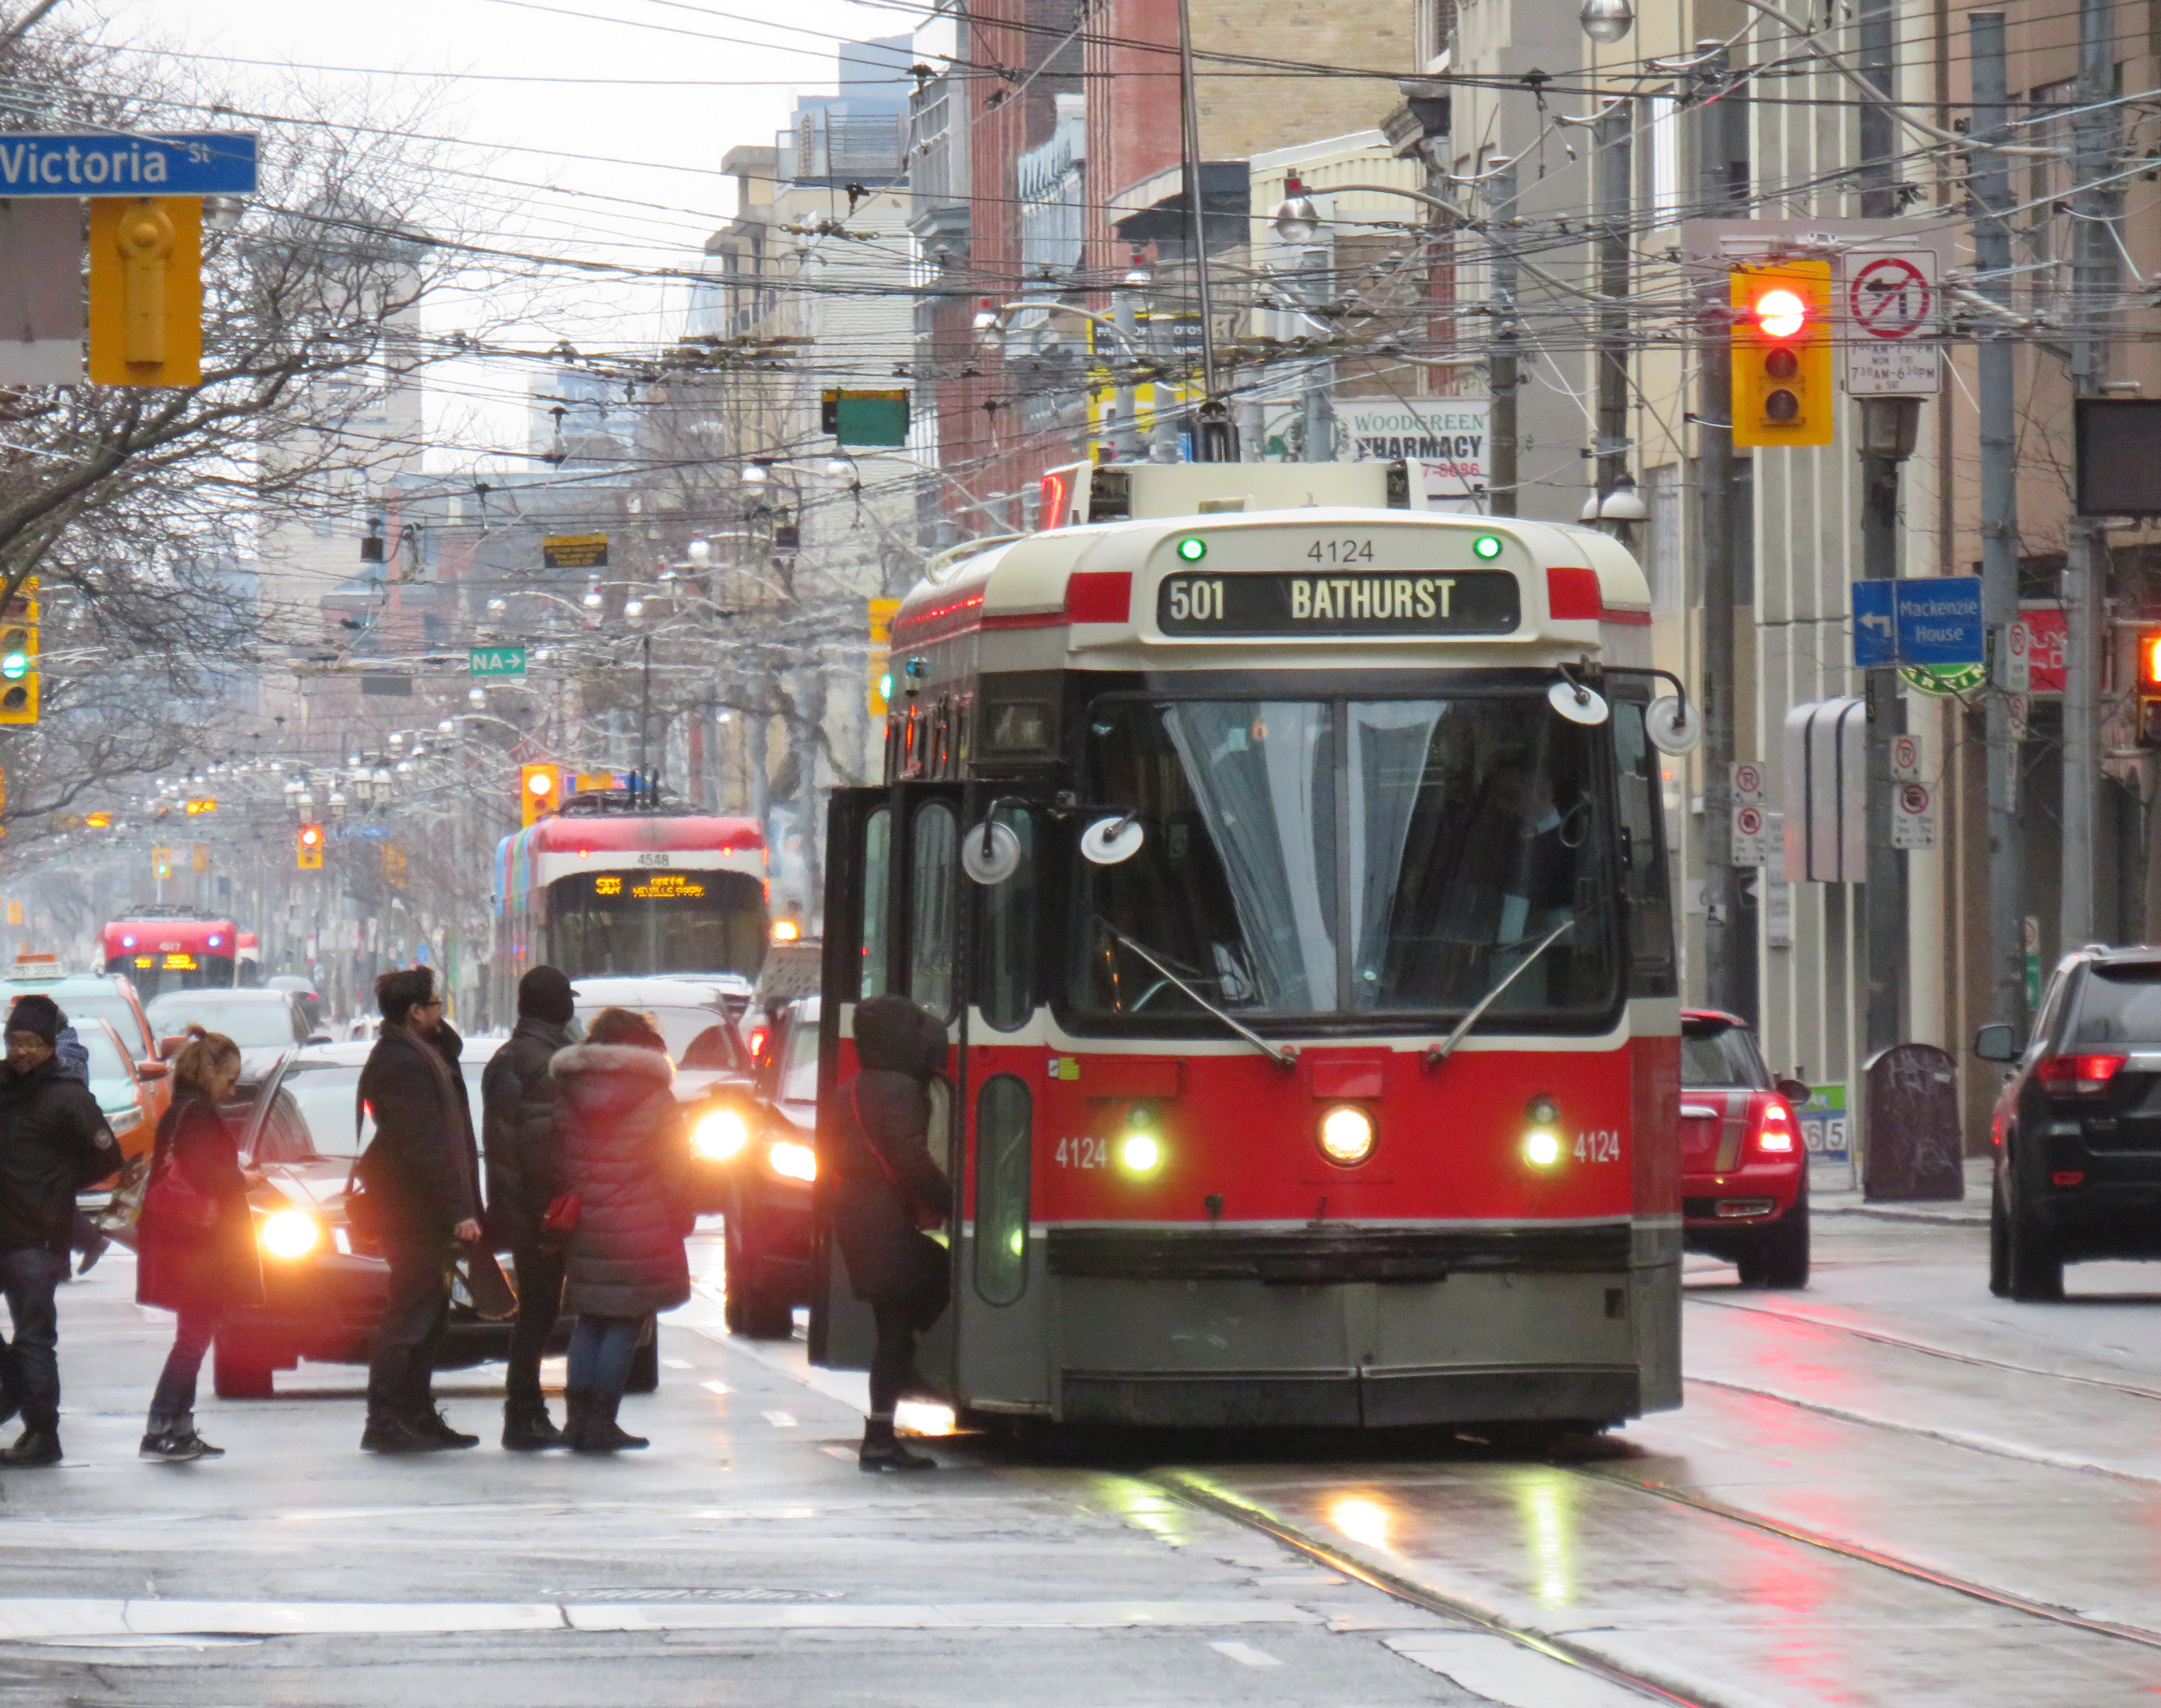
    Though I want to remain optimistic, I suspect it won’t be until the end of April at least before some of the social distancing requirements are relaxed. Though it’s tough for many of us, it is necessary to keep hospitals from being overwhelmed and the population as healthy as possible.

    We’ve been streaming more movies and television shows and playing party games remotely with family and friends online, with audio and video links to keep us engaged with each other. Sometimes on our walks, we’ll order takeout from some of our favourite independent restaurants and coffee shops.

    These are some of the little things that can be done when very little is asked of most of us.

    IMG_8066-001

  • Some love for Ontario’s municipal flags

    Some love for Ontario’s municipal flags

    Flag of TorontoThe flag of the City of Toronto, designed by Renato De Santis, is an example of a very good civic flag

    I was in Orillia last week, mainly to check out the new Simcoe County Lynx bus system. While there, the flag flying from the Opera House (formerly the city hall) caught my attention. Most municipal flags are boring, usually consisting of the town or city’s coat of arms, shield, or logo on a plain background.

    Orillia municipal flag, with a yellow sun in the middle

    But Orillia’s flag is different. It has waving blue and white waves, with two green triangles facing the centre, and a bright yellow sun in the middle. The symbolism wasn’t difficult to figure out: the city’s position on the narrows between Lake Simcoe and Lake Couchiching, with the sun being a nod to Orillia author Stephen Leacock’s Sunshine Sketches of a Little Town, a light, humourous collection of short stories about the denizens of Mariposa, a thinly-veiled fictionalization of Orillia.

    Yet Canadian cities that boast populations twenty or thirty times that of Orillia can’t boast having such a fine flag.

    For the most part, we don’t think about state, provincial, and municipal flags, and that’s a pity. In the few cities that have an unique and powerful flag, they have become part of that city’s iconography. Unfortunately, though Toronto does have a very good civic flag, we don’t fly it like it should.

    According to the North American Vexillological Association, there are five principles for creating a good flag:

    • Keep it simple — so simple, it can be drawn by a child from memory
    • Use meaningful symbolism
    • Use two or three basic colours
    • Never use lettering or seals
    • Be distinctive or be related

    Canada’s flag, adopted in 1965, adheres to these principles perfectly. It uses just two basic colours: red and white. With a large red maple leaf in the middle, it’s easily recognizable around the world. While a child might not get the eleven-point maple leaf exactly right, it’s otherwise easy to draw from memory.

    There are, of course, exceptions to these principles.

    Maryland’s complicated state flag, based on the coat of arms of colony founder Cecil Calvert, Lord Baltimore, is distinctive and popular, nearly as common as the US flag. California’s state flag is emblazoned with the words “California Republic” but it has significant historical meaning. The flag of South Africa, adopted in 1994, has six colours, but by merging the Pan-African colours of the African National Congress with the red white and blue of Britain and the Netherlands, it represents unity in the post-apartheid era.

    Flags of Maryland, California, and South Africa, notable exceptions to the rules

    For the most part, famous and great civic flags adhere to these principles. The flags of Amsterdam, Berlin, Chicago, and Tokyo all stand out. In Chicago and Amsterdam, these flags are proudly flown from private homes and watercraft, found on t-shirts and souvenirs, and well known around the world. The bear from Berlin’s flag is almost as popular as the Ampelmännchen. Though Amsterdam’s flag’s origins go back centuries (the “x”s are actually St. Andrew’s crosses), it looks bad-ass, and on-brand for a city famous for its tolerance.

    Great civic flags: Amsterdam, Berlin, Chicago, Tokyo

    Compared to the great examples above, Ontario’s provincial flag is just bad. Compare the provincial red ensign with the flag of Manitoba, and then compare it to the Franco-Ontarien flag.

    The Ontario and Manitoba flags, British red ensigns defaced with the provincial shields, were only adopted in 1965 and 1966 as conservative reactions to the new flag of Canada. The two flags are difficult to tell apart from a distance, and they both contain the St. George’s cross (representing England) twice: once in the union flag in the canton, and again in the shield. There’s very little Ontario to be found. (At least the Manitoba flag contains a bison, a recognizable symbol of that province.)

    Meanwhile, the Franco-Ontarien flag is immediately recognizable, with the fleur-de-lis and a stylized trillium, the provincial flower, representing the French-Canadian presence in Ontario.

    Like Orillia, there are a few other civic flags in Ontario that get it right.

    Flags of Thunder Bay, Hamilton, Ottawa, and Toronto

    Thunder Bay’s flag depicts a rising sun above Lake Superior and the Sleeping Giant, a prominent natural landmark across the water. The flag of Hamilton includes a yellow cinquefoil, the badge of the Clan of Hamilton, with a steel chain with six large links representing the steel industry and the six municipalities amalgamated into the modern city. The flag of Ottawa contains the civic logo, with the points representing waterways and the Peace Tower on Parliament Hill. Finally, the flag of Toronto has an abstract depiction of Toronto’s city hall, with a maple leaf where the council chamber sits. The two towers also make a “T.”

    It’s a shame that Toronto doesn’t make more of its simple, yet great flag.

    Unfortunately, most flags look like those used by Ontario’s third and fourth largest cities.

    Mississauga’s flag violates most of the principles listed above by including the name of the place it represents, with the addition of “incorporated 1974” at the bottom. In the middle is the civic shield, with the typical trappings: a cog representing industry, a lighthouse representing a port (Port Credit), a waterwheel, a stalk of wheat, and wings, possibly representing Pearson Airport. Though Mississauga is a proud city with its own identity, this flag doesn’t appear except in front of civic buildings.

    Brampton’s flag is just the civic shield on a white background, again with similar trappings: a bushel of wheat, a plow, a steam locomotive, and a beaver. According to the city’s website, the gold colour and castle top signify the city’s relation with the small Cumbrian town of Brampton, England. The shield dates from the small rural town before post-war growth, with only a pine tree in the middle to represent the old township of Chinguacousy it merged with. There’s no recognition of Brampton’s modern identity as a multicultural city.

    But at least they’re not as bad as the worst city flag identified by the North American Vexillological Association, that of the city of Pocatello, Idaho, which manages to include the city slogan, a trademark, and a copyright notice. After some embarrassment, the city came up with a new, much better flag.

    Old Flag of PocatelloThe former flag of Pocatello, Idaho

    It would be wonderful to see Brampton and Mississauga come up with better designs. Brampton’s new logo and slogan, Flower City, better represents the city’s history and ambitions. A pretty good flag could be made out of that.

    As for Toronto, let’s embrace our flag more. It’s a fine one and far better than the province’s. As Torontonians generally think of themselves as Canadian first, Torontonian second, and Ontarian third, perhaps we should give our municipal banner more love.

  • A farewell to Toronto’s CLRV streetcars

    IMG_6892-001.JPG

    On December 29, 2019, the Toronto Transit Commission’s venerable Canadian Light Rail Vehicles disappeared from the city’s streets. To mark the occasion, six CLRVs, offering free rides, were put into service on Queen Street between 10:00 AM and 2:00 PM before a ceremonial last run to Russell Carhouse in Toronto’s east end.

    The first six CLRVs, 4000-4005, were built by SIG in Switzerland, and entered service on the 507 Long Branch route on September 30, 1979. An additional 190 streetcars were built by Hawker-Siddeley in Thunder Bay, with the last cars arriving in 1981. Those were followed by 52 articulated ALRV streetcars, which were delivered between 1987 and 1989, and retired earlier this year.

    The CLRVs were unique to Toronto, designed by and for the TTC. Other North American cities that still operated streetcars in the 1970s opted for different designs to replace their ageing PCCs, though Boston have the CLRVs a try.

    Several CLRV and ALRV streetcars will be preserved at transit museums, including the Halton County Radial Railway near Rockwood, Ontario; two CLRVs will remain on TTC property for special events.

    With the arrival of the last of the 204 Bombardier Flexity low floor streetcars this month and the retirement of the CLRVs, the entire TTC fleet is now 100% wheelchair accessible and fully air-conditioned. Gone, too, with the CLRVs are back-lit vinyl destination signs, treadle rear doors that open by stepping on the stairs, and windows that open at face level and the warnings to keep arms inside.

    Streetcar 4124 on December 29, 2019Streetcar 4124 picks up passengers at Yonge Street, December 29, 2019

    Though the accessibility and the capacity of the new Flexity streetcars represent major improvements, I will miss the old CLRVs, and not just because they’re the last transit vehicle in Toronto that are older than I am. I was fascinated by Toronto’s streetcars at an early age. As a child growing up in Brampton, I would lobby hard to ride Toronto’s subways and streetcars whenever we went downtown as a family. My parents took me on a ride on the 501 Streetcar between downtown and Parkdale (with lunch at Harry’s Charbroiled Burgers when it was across from the Gladstone Hotel) when I was seven.

    IMG_6907-001Streetcar 4178, A Streetcar Named Toronto, at Greenwood Avenue, December 29, 2019

    Once I was old enough, at age thirteen, I was making my own trips to Toronto, taking GO Transit trains from Downtown Brampton or Mississauga Transit buses from Shoppers World and Square One to the subway, buying a day pass, and then spending a day wandering the city. The high floor CLRV and ALRV streetcars with their open windows offered great views of the city rolling by.

    I continued to ride the rocket regularly when I attended university, taking advantage of breaks between classes to ride further out into the suburbs, eventually riding nearly every bus route in the city. Even after I moved to Toronto, a streetcar ride was an affordable delight (as long as I wasn’t in a rush).

    IMG_6927-001.JPGShort turn: Swiss-built CLRV 4001 turns into Wolesley Loop at Bathurst and Queen

    My favourite seats were right at the back, with the curved rear with great views on three sides, similar to the bullet lounge at the end of VIA Rail’s Canadian and Ocean trains. The single seats on the operator’s side of the streetcar were also favourites.

    Though the last of Bombardier’s 204 new Flexities have finally arrived, there is still a streetcar shortage in Toronto. The 505 Dundas and 502/503 Kingston Road routes continue to be operated with buses. Many of the new vehicles planned for Dundas and Kingston have been reallocated to King Street, where the transit priority project resulted in a significant increase in ridership. The TTC wishes to purchase 60 more streetcars to fully furnish the existing demand and support expansion on the waterfront, but funding isn’t yet available.

    Unfortunately, buses will have to fill in those gaps as the CLRVs disappear.

    IMG_6936.JPG
    Retired streetcars at Russell Carhouse await their fates

    Thanks for the memories!

  • The dangers of Don Mills Road

    IMG_3664.JPGDon Mills Road looking south towards McNicoll Avenue, North York

    On the afternoon of Tuesday July 16, a woman was struck and killed by the driver of a left-turning waste collection truck as she was crossing the street. The tragedy happened at the corner of Cliffwood Road and Barkwood Crescent, in a quiet North York residential neighbourhood. The 68-year old was the eighteenth pedestrian killed on Toronto’s streets in 2019. 

    Cliffwood Road is a typical suburban residential street in northeast North York, just south of the municipal boundary at Steeles Avenue. It meets Don Mills Road twice; at the north end, there are traffic signals, with a middle school and a plaza on the east side of the four-way intersection. On the south side, Cliffwood meets Don Mills at a three-way intersection, protected only by a a stop sign facing Cliffwood. As Cliffwood loops back on itself and has no direct connections to Steeles Avenue, it is not a useful short-cut for speeding motorists unlike many other suburban streets.

    What, in particular, contributed to this deadly crash? I paid a visit to the area to find out.

    IMG_3647.JPGThe intersection of Cliffwood Road and Barkwood Crescent, looking southeast

    Between Don Mills Road and Barkwood Crescent, Cliffwood Road is 12 metres wide without any lane markings or medians to separate traffic or slow vehicles turning off of busy Don Mills Road. West of Barkwood Crescent, Cliffwood Road narrows to 8.5 metres. Twelve metres is a lot of road space: Beverley Street in Downtown Toronto is the same width, but it has two driving lanes, a parking lane, and two unprotected bike lanes. The wide street width here only encourages motorists to drive fast after coming off Don Mills Road, while wide curb radii at the corners at Don Mills and at Barkwood Crescent also encourage motorists to take turns quickly.

    At Barkwood Crescent, Cliffwood Road has a speed limit of 50 km/h, the default speed limit in the City of Toronto. Closer to the schools to the north, a 40 km/h speed limit is posted, but there are no physical measures to slow down cars and trucks. Cliffwood Road, like so many other suburban streets, was built for speed, and not for local residents on foot.

    IMG_3648-001An unnecessarily large intersection at Cliffwood Road and Barkwood Crescent, and a wide approach to Don Mills Road

    I also noted the condition of nearby Don Mills Road, a busy thoroughfare connecting office parks in Richmond Hill and Markham with Fairview Mall to the south. Don Mills is a busy bus corridor, with both TTC and YRT buses providing frequent weekday service.

    Despite the frequent bus service, Don Mills Road is hostile to pedestrians and transit users. At the southern intersection of Don Mills and Cliffwood Roads, the nearest crosswalk is nearly 300 metres to the north, or 600 metres to the south. Understandably, most transit users will choose to cross at the nearest TTC stop, rather than walk an extra five or ten minutes twice a day, especially in inclement weather.

    In late August, a pedestrian was crossing Sheppard Avenue East in Scarborough to get to a nearby TTC bus stop when she was fatally struck by a motorist who then fled the scene. That stretch of Sheppard Avenue is flat and straight.

    IMG_3652-001The corner of Cliffwood and Don Mills Roads with bus stops

    Most area bus stops are adjacent to bus bays. Bus bays are designed to get buses out of the way of traffic while they are dropping off and picking up passengers. Once the bus is ready to leave the bus stop, it must then merge back into traffic. In addition, many of these bus bays double as right-turn lanes, increasing the distance a pedestrian must cross the street.

    Furthermore, Don Mills has several hills and curves north of Finch Avenue that makes this especially dangerous because of low visibility, making it difficult to judge how far or how fast traffic may be coming. There are five lanes plus bus bays/right turn lanes; the centre lane alternates between serving as a left turn lane or a striped buffer space between northbound and southbound traffic, which further encourages high speeds.

    IMG_3663-001.JPGBus stop at Don Mills Road and Mogul Drive, illustrating the high-speed curves

    It is no wonder too that cyclists choose the sidewalks. Despite the wide right-of-way with generous boulevards between the backyard fences and the curbs, no though has been made to improve cycling infrastructure in this part of Toronto. Separated bike lanes or a multi-use path, similar to those on Eglinton Avenue in Etobicoke, or in Peel Region, would make sense here, and along other suburban arterials.

    Cross-ride marking and signals at intersections would improve the safety for suburban cyclists and legitimize a common practice.

    IMG_3630-001Cyclists take the sidewalk on Don Mills Road

    At the end of my tour of upper Don Mills Road, I could not help but notice I was walking in a signed “Seniors Safety Zone.” As with Eglinton Avenue East in Scarborough, signs were put up but no measures were put in place to slow motorists down, and there was no sign of police enforcement of the posted limit either.

    IMG_3684-001.JPG“Seniors Safety Zone” – note the bus bay behind the sign

    There are a few things that can be done in Toronto’s suburbs to improve the safety of vulnerable road users (pedestrians and cyclists) and reduce the incidence and severity of crashes when they do happen. The installation of safer pedestrian crossings, such as traffic signals would reduce the distance required to get to a TTC stop safely. Bus bays should be eliminated with every road reconstruction project, as they do not benefit transit riders and encourage fast-moving traffic. Finally, residential streets should be narrowed, especially at intersections to slow motorists down, reduce the time a pedestrian is in the street while crossing, and improve their visibility.

    Finally, wide multi-use paths along suburban corridors like Don Mills Road would help promote active transportation and reduce conflicts between pedestrians and cyclists.

  • The story of Toronto’s streetcar “bull’s eyes”

    7566316174_524a59174e_o.jpgReplica of Toronto Railway Company streetcar #327 operates at the Halton County Radial Railway museum, with the unique glass bulbs visible below the metal “Belt Line” sign. Photo taken June 2012

    In 1891, the Toronto Railway Company (TRC) was created, taking over the city’s streetcar system from its predecessor, the Toronto Street Railway. The TRC quickly began electrifying Toronto’s transit network, operating fifteen routes across the city. Electric streetcars were faster than horse-drawn trams, and passengers had difficulties figuring out which streetcar was theirs at night.

    This was a problem as many streetcar routes overlapped. For example, Dupont and Avenue Road streetcars operated on Yonge Street south of Bloor, and Belt Line and Yonge streetcars both ran on Front Street. While the TRC had metal signs on the top and sides of each streetcar to denote the route, they weren’t illuminated. With electric light still in its infancy — arc lamps were too intense while early incandescent lamps were too dull to adequately illuminate route signs — the TRC developed an ingenious solution: uniquely coloured glass bulbs mounted on the roof, lit by interior lights. These lights became known as “bull’s eyes.”

    Under this scheme, the Yonge Streetcar could be identified by one blue light, while the Broadview Streetcar could be identified with red and green lights. This system required passengers to memorize their route’s colours, and as new routes were introduced, changed, or withdrawn, it became cumbersome. Eventually, lighting technology caught up: while back-lit destination signs were possible by 1910, the TRC became hesitant to spend any capital funds to modernize its fleet or expand the streetcar railway network. The City of Toronto was forced to start its own streetcar system, the Toronto Civic Railway, to serve outlying neighbourhoods.

    Though the Ontario Railway Board (predecessor to the Ontario Municipal Board) refused to force the TRC to expand the street railway network beyond the 1891 boundaries, it ordered the TRC to install backlit route signs. These new signs were introduced in February 1913, and those unique coloured bulbs disappeared by 1915. Six years later, the TRC’s franchise was up, and the city-owned Toronto Transportation Commission came into being.

    In 1935, the TTC re-introduced “bull’s eyes” to its streetcar fleet. Officially known as an advance light, a single roof-mounted light, which gave off a blue-green hue, was designed to let waiting passengers know a streetcar was on its way. At the same time, the TTC installed dash lights, which both illuminated advertising cards and provided additional lighting, a useful safety feature.

    IMG_7929-001.JPGTTC PCC Streetcar #4549 on Queen Street West in September 2018

    New PCC streetcars, which began arriving in 1938, were built with the advance lights already installed. By 1940, all streetcars, including the remaining wooden cars acquired from the Toronto Railway Company, were equipped with advance lights. After the Second World War, PCC streetcars purchased from cities such as Cincinnati, St. Louis, and Kansas City, were similarly fitted with the roof-mounted lamps.

    IMG_8717-001.JPGCLRV streetcar on Queen Street East, with two blue-green advance lights above the back-lit destination sign. 

    By the 1970s, the TTC decided to maintain its street railway fleet after planning for their eventual replacement with buses and subways, and sought a replacement fleet for its ageing PCCs. The new Canadian Light Rail Vehicles (CLRVs) and Articulated Light Rail Vehicles (ALRVs) were designed with dual advance lamps, mounted within the streetcar body, immediately above the destination sign.

    Advance lights were introduced to TTC buses starting in the mid-1990s, as new wheelchair-accessible vehicles were added to the fleet, starting with high-floor Orion V and Nova RTS buses, and continuing with newer low-floor vehicles. Blue lights indicated that the bus was accessible. As a bonus, when combined with new digital orange LED destination signs, the bus advance lights served to further improve the visibility of approaching transit vehicles.

    11041809023_47fc64e5e7_o.jpgNova articulated bus with orange LED destination sign and blue LED advance lights indicating it is an accessible vehicle

    The new Bombardier Flexity streetcars are similarly equipped with new blue LED lights, as they too are fully accessible vehicles. While blue advance lights are unique to TTC buses, the new light rail vehicles for Waterloo Region’s ION LRT, also built by Bombardier, sport similar blue lights.

    IMG_8421-002.JPGION LRT vehicle undergoing testing in Kitchener, February 2019

    Sources:
    John F. Bromley and Jack May: Fifty Years of Progressive Transit (Electric Railroaders’ Association, 1973)
    Mike Filey: Not a One-Horse Town: 125 years of Toronto and its Streetcars (Firefly Press, 1990)

  • A year later, progress on Canongate Trail

    IMG_8531-001
    Canongate Trail, February 2019

    In February 2018, Duncan Xu, an 11-year old boy, was struck and killed crossing a residential street in North Scarborough on his way home from school. He was one of forty-two pedestrians unintentionally struck and killed by motorists in Toronto last year.

    Not long after Duncan’s death, I visited the neighbourhood and wrote about the tragedy.  Canongate Trail, where Duncan was struck, is a two-lane residential street. At the time, there were no traffic calming measures in place to slow down motorists, many of whom used Canongate as a shortcut around the busy intersection of Kennedy Road and Steeles Avenue. The local councillor, Jim Karygiannis, decided to unilaterally close a walkway linking the rear schoolyard with Canongate Trail, close to where Duncan was killed. Duncan used the walkway before he tried to cross the street.

    Since then, more permanent fixes were made. At the request of Karygiannis and local residents, city staff studied both reducing speed limit and installing traffic calming measures. While staff recommended reducing the speed limit to 30 kilometres an hour, they concluded that traffic calming measures such as speed humps were unwarranted.

    The speed humps were added anyway, along with other measures. A new all-way stop was added at Ockwell Manor Drive, near where the walkway meets the Canongate Trail sidewalk. Beyond the point where the walkway meets the sidewalk, fencing was installed to discourage children from running into the street. These are significant improvements.

    IMG_8530-001The walkway to the school and a nearby park is reopened, with a metal barrier between the sidewalk and the roadway

    Still, more can always be done. Curb extensions or bulb-outs at intersections would be another effective traffic calming measure, narrowing the roadway, slowing down turning vehicles, and increasing pedestrian visibility while reducing pedestrian crossing distances.

    What’s most disheartening though is that it took a young child’s death for these measures to happen. All residential streets should have a 30 km/h limit and streets designed to slow motorists down, including measures such as curb extensions and speed humps. As with the “Slow Down – Kids at Play” lawn sign campaign, action only comes after a high-profile tragedy. Even then, it’s not enough.

    It’s good to see progress on Canongate Trail. But this should be the standard everywhere. We can and should do better in Toronto if we are all serious about implementing a true Vision Zero policy.

    IMG_8535-001New 30 km/h speed limit and a new stop sign on Canongate Trail, February 2019

    IMG_6027-001What Canongate Trail looked like in March 2018

  • Voter turnouts in the 2018 Toronto municipal election

    2014 was a watershed year for municipal voter turnout in Toronto. After a disastrous four years of Rob Ford as mayor, 54.7 percent of all eligible voters went to the polls, electing John Tory. That was the highest voter turnout in decades, even higher than 1997, when Torontonians elected Mel Lastman to lead a newly amalgamated City of Toronto. In 2010, when Rob Ford was elected mayor, turnout was 50.4 percent, compared to 39.3 percent in 2006 and 38.3 percent in 2000.

    Four years ago, the mayoral race was especially competitive. Progressive Olivia Chow was the initial front-runner against Ford, but Tory (who previously ran for mayor in 2003) pulled ahead as Chow’s campaign floundered. Late in the campaign, Rob Ford dropped out due to health concerns, so his brother Doug took his place. Among the three frontrunners, Tory got 40.3 percent of the vote, while Doug Ford took 33.7 percent. Chow only got 23.1 percent. Voters also elected seven new councillors that year, and returned Rob Ford to Ward 2.

    After two elections in which over half the number of eligible voters took part, in 2018 voter turnout fell to just 40.9 percent. This was hardly surprising. John Tory cruised to victory despite a challenge by former chief planner Jennifer Keesmaat, while a sudden reduction in the number of wards confused voters and crushed the hopes of many council hopefuls and their supporters.

    Though 769,000 electors voted in this mess of an election, voter turnout varied across the city. In Ward 23, Scarborough North, only 34.1 percent of eligible voters turned out to the polls. In Ward 7, Humber River-Black Creek, just 34.6 percent of electors voted. Ward 10, Spadina-Fort York, had the third worst turnout, with just 34.8 percent.

    Areas with the highest voter turnout were Midtown and east end Toronto. Ward 14, Toronto-Danforth had the highest turnout, where 49.2 percent of electors cast a vote. It was followed by Ward 15 and Ward 12 (both of which had 48.5 percent turnout) and Ward 19, where 48.4 percent of electors went to the polls.

    Wards 12, 14, 15, and 19 had interesting and competitive council races. In Ward 14, the race featured two progressive incumbents, while Ward 19 was one of just two races in which an established city councillor was not running for re-election. Wards 12 and 15 also had competitive races. However, in Ward 4, Gord Perks won re-election easily.

    Yet Ward 23 had an open council race in which no incumbent was running. And Ward 7 was one of the most interesting and important races of 2018; this is where Giorgio Mammoliti was finally defeated after years of campaign violations, buffoonery, and embarrassments.

    2018-election-turnout-by-ward-e1547405800521.jpg

    2018 voter turnout by ward (alternate version available here)

    Voter turnout has consistently been low in Toronto’s northwest and northeast corners. In 2014, Ward 8 and Ward 41 (which made up parts of new Wards 7 and 23) had the lowest numbers of electors casting a vote. Turnout was highest in more affluent neighbourhoods, especially in places like Midtown Toronto, the Kingsway neighbourhood in Etobicoke, and in Toronto’s East End. What surprised me mostly was the poor turnout in Ward 10 in 2018.

    2014-election-turnout-e1547405905585.jpg

    2014 voter turnout by ward (alternate version available here)

    The difference in voter turnout across the city is more apparent at the neighbourhood level. With the poll-level results available through Toronto’s Open Data Catalogue, I allocated the poll results to each of Toronto’s 140 neighbourhoods, while adjusting the numbers based on the number of votes cast in the advance polls in each ward. The map below shows voter turnout at the neighbourhood level in 2018.

    citydata-nabes-turnouts-2018-e1547406217401.jpg
    2018 voter turnout by neighbourhood (alternate version available here)

    What is immediately apparent is that voter turnout is highest in many neighbourhoods surrounding Toronto’s downtown core, while turnout is lowest in the former City of York, in northwestern Toronto and parts of Scarborough. Areas of high voter turnout tend to be affluent neighbourhoods with high levels of home ownership. These neighbourhoods include the Kingsway, Lawrence Park, Leaside, Cabbagetown, Rosedale, Forest Hill, Swansea, the Beaches, and Leaside. Many of these areas also have active residents’ associations. With Ryerson professor Myer Siemiatycki, I looked at the results of previous municipal election voter turnouts in a report published by the Maytree Foundation.

    Downtown, areas with major condominium developments also have lower turnout, especially in places like the Waterfront, CityPlace, Liberty Village, and the Bay Street corridor. These areas are more likely to have younger residents and many renters. Engaging voters both in downtown condos and those living in the inner suburbs remains a challenge. While voter turnout was much higher in 2014 across the city, the same basic patterns are evident.citydata-nabes-turnouts-2014.jpg
    2014 voter turnout by neighbourhood (alternate version available here)

  • Mapping the results in Ward 4 Parkdale-High Park and Ward 9 Davenport

    In the penultimate post in my series examining the results of the 25 council races in the October 2018 municipal election here in Toronto, I take a look at the results in Ward 4, Parkdale-High Park and Ward 9, Davenport in Toronto’s west end.

    Neither of the two ward-level results were surprising. Ward 4 returned progressive councillor Gord Perks to City Hall, while in Ward 9, there wasn’t much of a contest: centrist Ana Bailão was easily re-elected.

    At the start of 2018, once the 47 ward boundaries were confirmed, it looked as though Bailão was going to be in one of the most interesting council races. The west end of the old City of Toronto — old Wards 14, 17, and 18 — had low population growth compared to many other parts of the city, including northeast Scarborough, North York Centre, Humber Bay Shores, and Downtown. These new ward boundaries were designed to improve representation as the old 44 wards were based on federal ridings drawn in the 1990s. Even with three new wards, the west end would lose a seat on council. The way the boundaries were drawn, it meant that Bailão, elected in Ward 18, would be up against Cesar Palacio, elected in Ward 17.

    2014 Election - 2018 Ward Projections
    Differences in 2018 ward populations under the old 44-ward model. Toronto’s west end was one of several areas over-represented by the outdated boundaries.

    Under the 47-ward model, it would have been the only race in which two incumbents would have ran against one another and Bailão would have had the advantage.

    Palacio, a conservative, was vulnerable in the last few elections, challenged by progressive candidates Alejandra Bravo and Jonah Schein, with Palacio narrowly winning in 2010. With the new boundaries extending south to Bloor Street (the area south of Bloor shifting to join old Ward 14 represented by Gord Perks), Palacio’s base in the north half of his old ward would not have been enough — areas that voted for Bravo in 2014 would have certainly voted for Bailão in a two-candidate race.

    After Bill 5 was introduced and confirmed into law, things changed. Sarah Doucette, a progressive councillor representing old Ward 13 (Swansea, Bloor West Village and part of the Junction) withdrew from the race when her ward was joined with Ward 14 (Parkdale and Roncesvalles).

    Doucette, who was first elected in 2010, said that she wasn’t interested in serving on a 25 ward council. A councillor well-known for her local community activism, Doucette would have represented a much larger area, and would have run against Gord Perks, someone she describes as a friend. For his part, Perks said that “Doucette deeply embodied the values of decency and community at city council. It’s a crime that we’re losing her.”

    Meanwhile, Perks, who was running, still had several opponents in the new larger ward. They included David Ginsberg, owner of several restaurants and a coffee shop near Trinity-Bellwoods Park; Kalsang Dolma, a Parkdale-based artist and community activist; and Evan Tummillo, a property manager who ran against Doucette in 2014. Tummillo was endorsed by the Toronto Sun, while the Toronto Star endorsed Perks.

    In neighbouring Ward 9, Cesar Palacio quietly dropped out of the race in late September, only a few days before the new post-Bill 5 nomination deadline. This was a surprise, as he and Bailão had known that they would run against each other for a very long time. Only four other candidates had registered, none of whom enjoyed wide name recognition. Had Palacio withdrawn earlier, it is possible that a progressive candidate would have taken a shot at running against centrist Bailão.

    In Ward 4, Perks easily won re-election, taking 44.5 percent of the vote and placing first in all but five polls. Ginsberg placed a respectable second, with 21.6 percent. Ginsberg did best in the affluent Baby Point neighbourhood in former Ward 13, while Dolma did quite well in a few Parkdale polls, placing first in one. Tummillo got just 6.2 percent of the vote, coming first in just one poll, a seniors’ residence on Roncesvalles Avenue.

    2018 Election - W4.jpg
    Poll-level results for Ward 4

    Meanwhile, in Ward 9, Ana Bailão got the highest winning margin of any council candidate, taking 83.6 percent of the vote. As the councillor in the old City of Toronto most allied with Mayor John Tory, Bailão has since been named to the executive committee and chair of the new planning and housing committee. Perks, on the other hand, was shut out of Tory’s inner circle.

    Bill 5 meant losing councillors that knew their wards intimately. While councillors will be able to hire more staff to help manage these local issues, it’s still an unfortunate loss of local representation.


    Ward 4 Parkdale-High Park
    Candidate Votes Percent
    Kalsang Dolma 5,352 14.1
    David Ginsberg 8,181 21.6
    Valerie Grdisa 1,771 4.7
    Taras Kulish 868 2.3
    Gord Perks 16,887 44.5
    Nick Pavlov 874 2.3
    Alex Perez 686 1.8
    Evan Tummillo 2,367 6.2
    Ward 9 Davenport
    Candidate Votes Percent
    Ana Bailão 26,219 83.6
    Mark Balack 1,114 3.6
    Nahum Mann 2,804 8.9
    Troy Young 1,218 3.9
  • Mapping the council races in Etobicoke Wards 1 and 2

    In 2018, Etobicoke went three for three in returning hard-line conservative councillors to City Hall. In Ward 3, Mark Grimes was re-elected despite several controversies, with Mayor John Tory’s help. In Ward 1 and Ward 2, councillors with famous names were re-elected, cementing local political legacies. While the results in Ward 1 Etobicoke North were predictable, the results in Ward 2 Etobicoke Centre were disappointing.

    Under the previous 44 wards and the approved 47-ward model, Etobicoke had six seats on Toronto City Council. With the 25 wards forced on the city when Bill 5 came into law, they were reduced to three.

    Ward 1 — Etobicoke North

    Prior to the new ward boundaries coming into effect, old Ward 1 was represented by Vincent Crisanti. Ward 1 sits in the far northwestern part of Toronto, bounded by Steeles Avenue and Highway 427, as well as the West Humber River to the south and the East Humber River. Its boundaries would not have changed in the 47-ward model.

    Crisanti was first elected in 2010, defeating incumbent centrist Suzan Hall. Crisanti was a reliable ally during the first few years of Rob Ford’s disastrous mayoralty. Despite this, he was named one of Tory’s four deputy mayors after the 2014 election. This lasted until September 2017 when Crisanti publicly backed Doug Ford’s plan to run against Tory again for mayor.

    Ward 2 was the domain of the Ford family. Rob Ford was first elected there in 2000, and had made a name for himself both for his constituency work and for his outspoken behaviour at City Hall. Ford was on the lone side of many 44-1 votes while David Miller was mayor. He ran for mayor in 2010 and won after Miller decided against a third term; his brother, Doug, was elected in Rob’s place in Ward 2. Doug never had Rob’s personal touch. Instead his time as councillor was focused on enabling Rob’s self-destructive behaviour, creating distractions, and coming up with waterfront land schemes that helped to erode Rob Ford’s authority on council, two years before the crack scandal broke. Doug even declared that his under-served ward had too many libraries and expressed his eagerness to close them, starting a fight with Margaret Atwood.

    Early in 2014, his work done, Doug Ford was ready to bow out. Rob and Doug’s 20-year-old nephew, Michael Stirpe, changed his last name to Ford, and registered to run in his uncles’ place. But in September 2014, Rob abandoned his bid for re-election for mayor due to his poor health and Doug ran instead. Michael withdrew in September 2014 to run for the local Toronto District School Board trustee position so Rob could run in his old ward. Rob won in Ward 2 easily, getting 58.8 percent of the vote, while Doug came in second place in the mayoral race.

    Toronto would continue to be haunted by Doug Ford.

    After Rob Ford’s death in March 2016, Michael Ford ran in a summer by-election, getting 70 percent of the vote, though only 9391 voters bothered to turn out. It was looking like Michael Ford would easily win again in 2018.

    But then Doug Ford engineered a takeover of the Ontario Progressive Conservatives, won the June 2018 provincial election, and wrecked local democracy in Toronto by imposing cuts to city council to just 25 wards. Despite his loyalty, Vincent Crisanti was just one more victim.

    Michael Ford was re-elected easily in the new combined Ward 1 with 42.3 percent of the vote, compared to Crisanti’s 34.3 percent. Other candidates such as Naiima Farah and Carol Royer spoke to the need for political change in a ward where three-quarters of the population are visible minorities. The Toronto Star endorsed Royer, a local entrepreneur and community activist, but she placed fifth, with just over 2 percent of the vote. Farah came in third, but got just 9 percent of the vote.

    Crisanti placed first in his old ward, getting 41 percent of the vote there while Michael Ford got 35 percent. In former Ward 2, Ford got over 50 percent of the vote compared to Crisanti’s 29 percent. Michael Ford had the support of his uncle; there were also over 2,000 more votes in the southern half of the ward. The result was not at all surprising.

    Farah placed first in two polls: Poll 055 on Dixon Road, and Poll 060, a highrise apartment near Eglinton Avenue and Martin Grove Road. Poll 055 is the home of many new immigrants, including a large Somali-Canadian community. Yet again, it was a shame that new voices, especially persons of colour, were shut out of this municipal election.

    2018 Election - W1.jpg
    Poll-level results in Ward 1, Etobicoke North

    Ward 2 — Etobicoke Centre

    Bill 5 also resulted in the amalgamation of former Wards 3 and 4.

    Ward 3 was represented by Stephen Holyday, the son of former Etobicoke mayor, Toronto councillor ,and one-time Ontario PC MPP Doug Holyday. The younger Holyday was first elected in 2014 and has been a reliable ally of John Tory, named one of Tory’s deputy mayors after Crisanti was stripped of the title in 2017. Along with Denzil Minnan-Wong, Holyday is one of council’s staunchest conservatives, as well as its most hostile to cyclists.

    Ward 4 was represented by John Campbell, a former chair of the Toronto District School Board. While a conservative, Campbell has been a more reasoned voice on city council than his fellow Etobicoke colleagues. For this reason, Campbell was endorsed by the Toronto Star.

    Also running were progressive candidate Erica Kelly, previously the NDP candidate in the provincial election, and Angelo Carnevale, who had the support of Doug Ford and Kinga Suma, the controversial Ford-backed PC MPP.

    Several polls previously located in old Ward 4 shifted to new Ward 1, while five polls in old Ward 2 shifted to Etobicoke Centre. This gave a slight advantage to Holyday, who did not lose any of his former ward.

    It was a close race, but Holyday won with 38.6 percent of the vote, while Campbell got 35.5 percent. Just 1186 votes separated the two incumbent candidates. Holyday was the first choice in all but two polls in former Ward 3 (two polls opted for Erica Kelly), while in former Ward 4, Holyday placed first in nine polls, Campbell placed first in just 28 election-day polls, but did well in the advance polls.

    Carnevale, who placed third with 15.1 percent, came first in just one poll, in an area previously represented by the Ford family. But Carnevale, who registered to run against Campbell in the old 47-ward model, helped to take support from Campbell, getting 20 percent of the vote in Campbell’s old turf versus 11 percent in former Ward 3. That, and the fact that there were nearly 3000 more voters in old Ward 3 than in old Ward 4, help to explain how Holyday was returned to city hall.

    Last week, Stephen Holyday was one of four suburban councillors named to the new striking committee that makes recommendations for council appointments to important committees, boards, and commissions. It’s quite clear that John Tory will be continuing an austerity agenda while shutting out urban councillors and progressives from decision making. Stephen Holyday will be an important part of that during the next four years.

    2018 Election - W2.jpgPoll-level results in Ward 2, Etobicoke Centre

    Ward 1 – Etobicoke North
    Candidate Votes Percentage
    Vincent Crisanti 8,654 34.3
    Peter D’Gama 253 1.0
    Naiima Farah 2,262 9.0
    Michael Ford 10,648 42.3
    Michelle Garcia 439 1.7
    Christopher Noor 214 0.9
    Shirish Patel 1,945 7.7
    Carol Royer 642 2.6
    Ward 2 – Etobicoke Centre
    Candidate Total Votes Percentage
    Bill Boersma 258 0.7
    John Campbell 13441 35.5
    Angelo Carnevale 5735 15.1
    Stephen Holyday 14627 38.6
    Erica Kelly 3854 10.2