 Last week, I wrote about how several TTC routes were facing overcrowding, despite the COVID-19 pandemic, and a severe drop in system-wide ridership since early March. I shared this analysis on Spacing’s website, and Ben Spurr at the Toronto Star reported more about the story this week.
Though detailed ridership data is not freely accessible, I wanted to see how ridership on the TTC, GO Transit, and other Greater Toronto and Hamilton Area transit agencies was faring. Helpfully, the team behind the Transit app, a trip-planning smartphone tool, made their usage data available to transit agencies, journalists, and data nerds to track transit demand during the pandemic. Although there are some limitations to using this data (more on that later), it’s an excellent metric for tracking transit ridership for dozens of major transit authorities across Canada and the United States, representing nearly every major metropolitan region.
The numbers used to determine transit ridership demand is based on usage of the Transit app. (While Transit is one of several apps that can be used to plan trips, including Metrolinx’s own Triplinx app, Transit is my favourite). Normal usage is defined by Transit as app sessions observed on the same day of the week one year ago, averaged over three weeks and corrected for yearly growth in the corresponding transit agency. Hence, a rapidly-growing system, such as Brampton’s, can be represented accurately by the app.
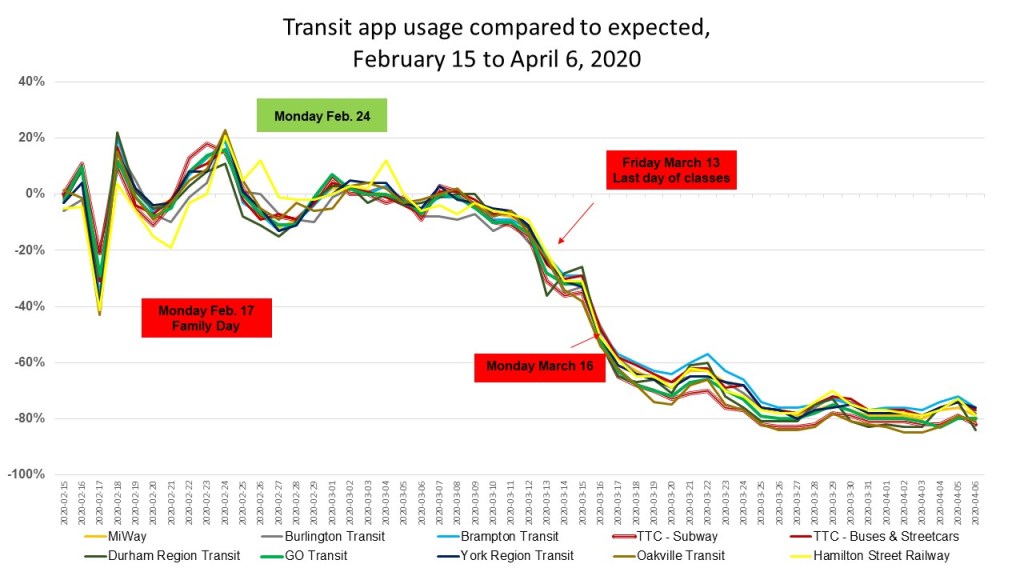
Data was available for every transit agency in the Greater Toronto and Hamilton Area, apart from paratransit services (e.g. Wheel-Trans, Transhelp, DARTS, etc.) and Milton and Caledon Transit, the smallest fixed-route services. The graph below shows the how the usage of the Transit app fluctuated based upon the expected value, reflected as a percentage.

Note how the actual Transit app usage dropped by over 40% for every transit agency on Monday, February 17, which was Family Day, a provincial holiday in Ontario. Most transit services were operating on a weekend or holiday service, while students and many workers did not take transit. This was likely compared with normal Mondays, hence the one-day drop.
It wasn’t until the second week of March that ridership began to decline as the number of COVID-19 cases began to surge in Canada and the United States, and governments began announcing new measures to reduce the rate of infection. On Thursday March 12, Ontario announced that public schools, scheduled to close for March Break, would stay closed for two additional weeks (the shutdown has since been extended). That day, the National Basketball League suspended the season, followed quickly by all other sports leagues. Employers began to implement contingency measures, such as work-from-home arrangements. By Monday the 16th, all restaurants were closed to sit-down clientele, and most entertainment venues closed.
By the week of March 29, transit demand was down by 75 to 82 percent across the Greater Toronto Area. Although many workers were either laid off or were sent home to work, employees in the healthcare, personal care, logistics, essential retail service (i.e. grocery workers), and food manufacturing industries remained on the job. This is evident in the difference between the demand for the subway (-81%) and the surface network (buses and streetcars, -76%) as they serve very different employment centres. Transit’s numbers are comparable to the TTC’s own ridership estimates.
-

Map depicting estimated drops in transit demand for GTHA transit agencies compared to expected use for week of March 29 to April 5, 2020. Data from Transit app.
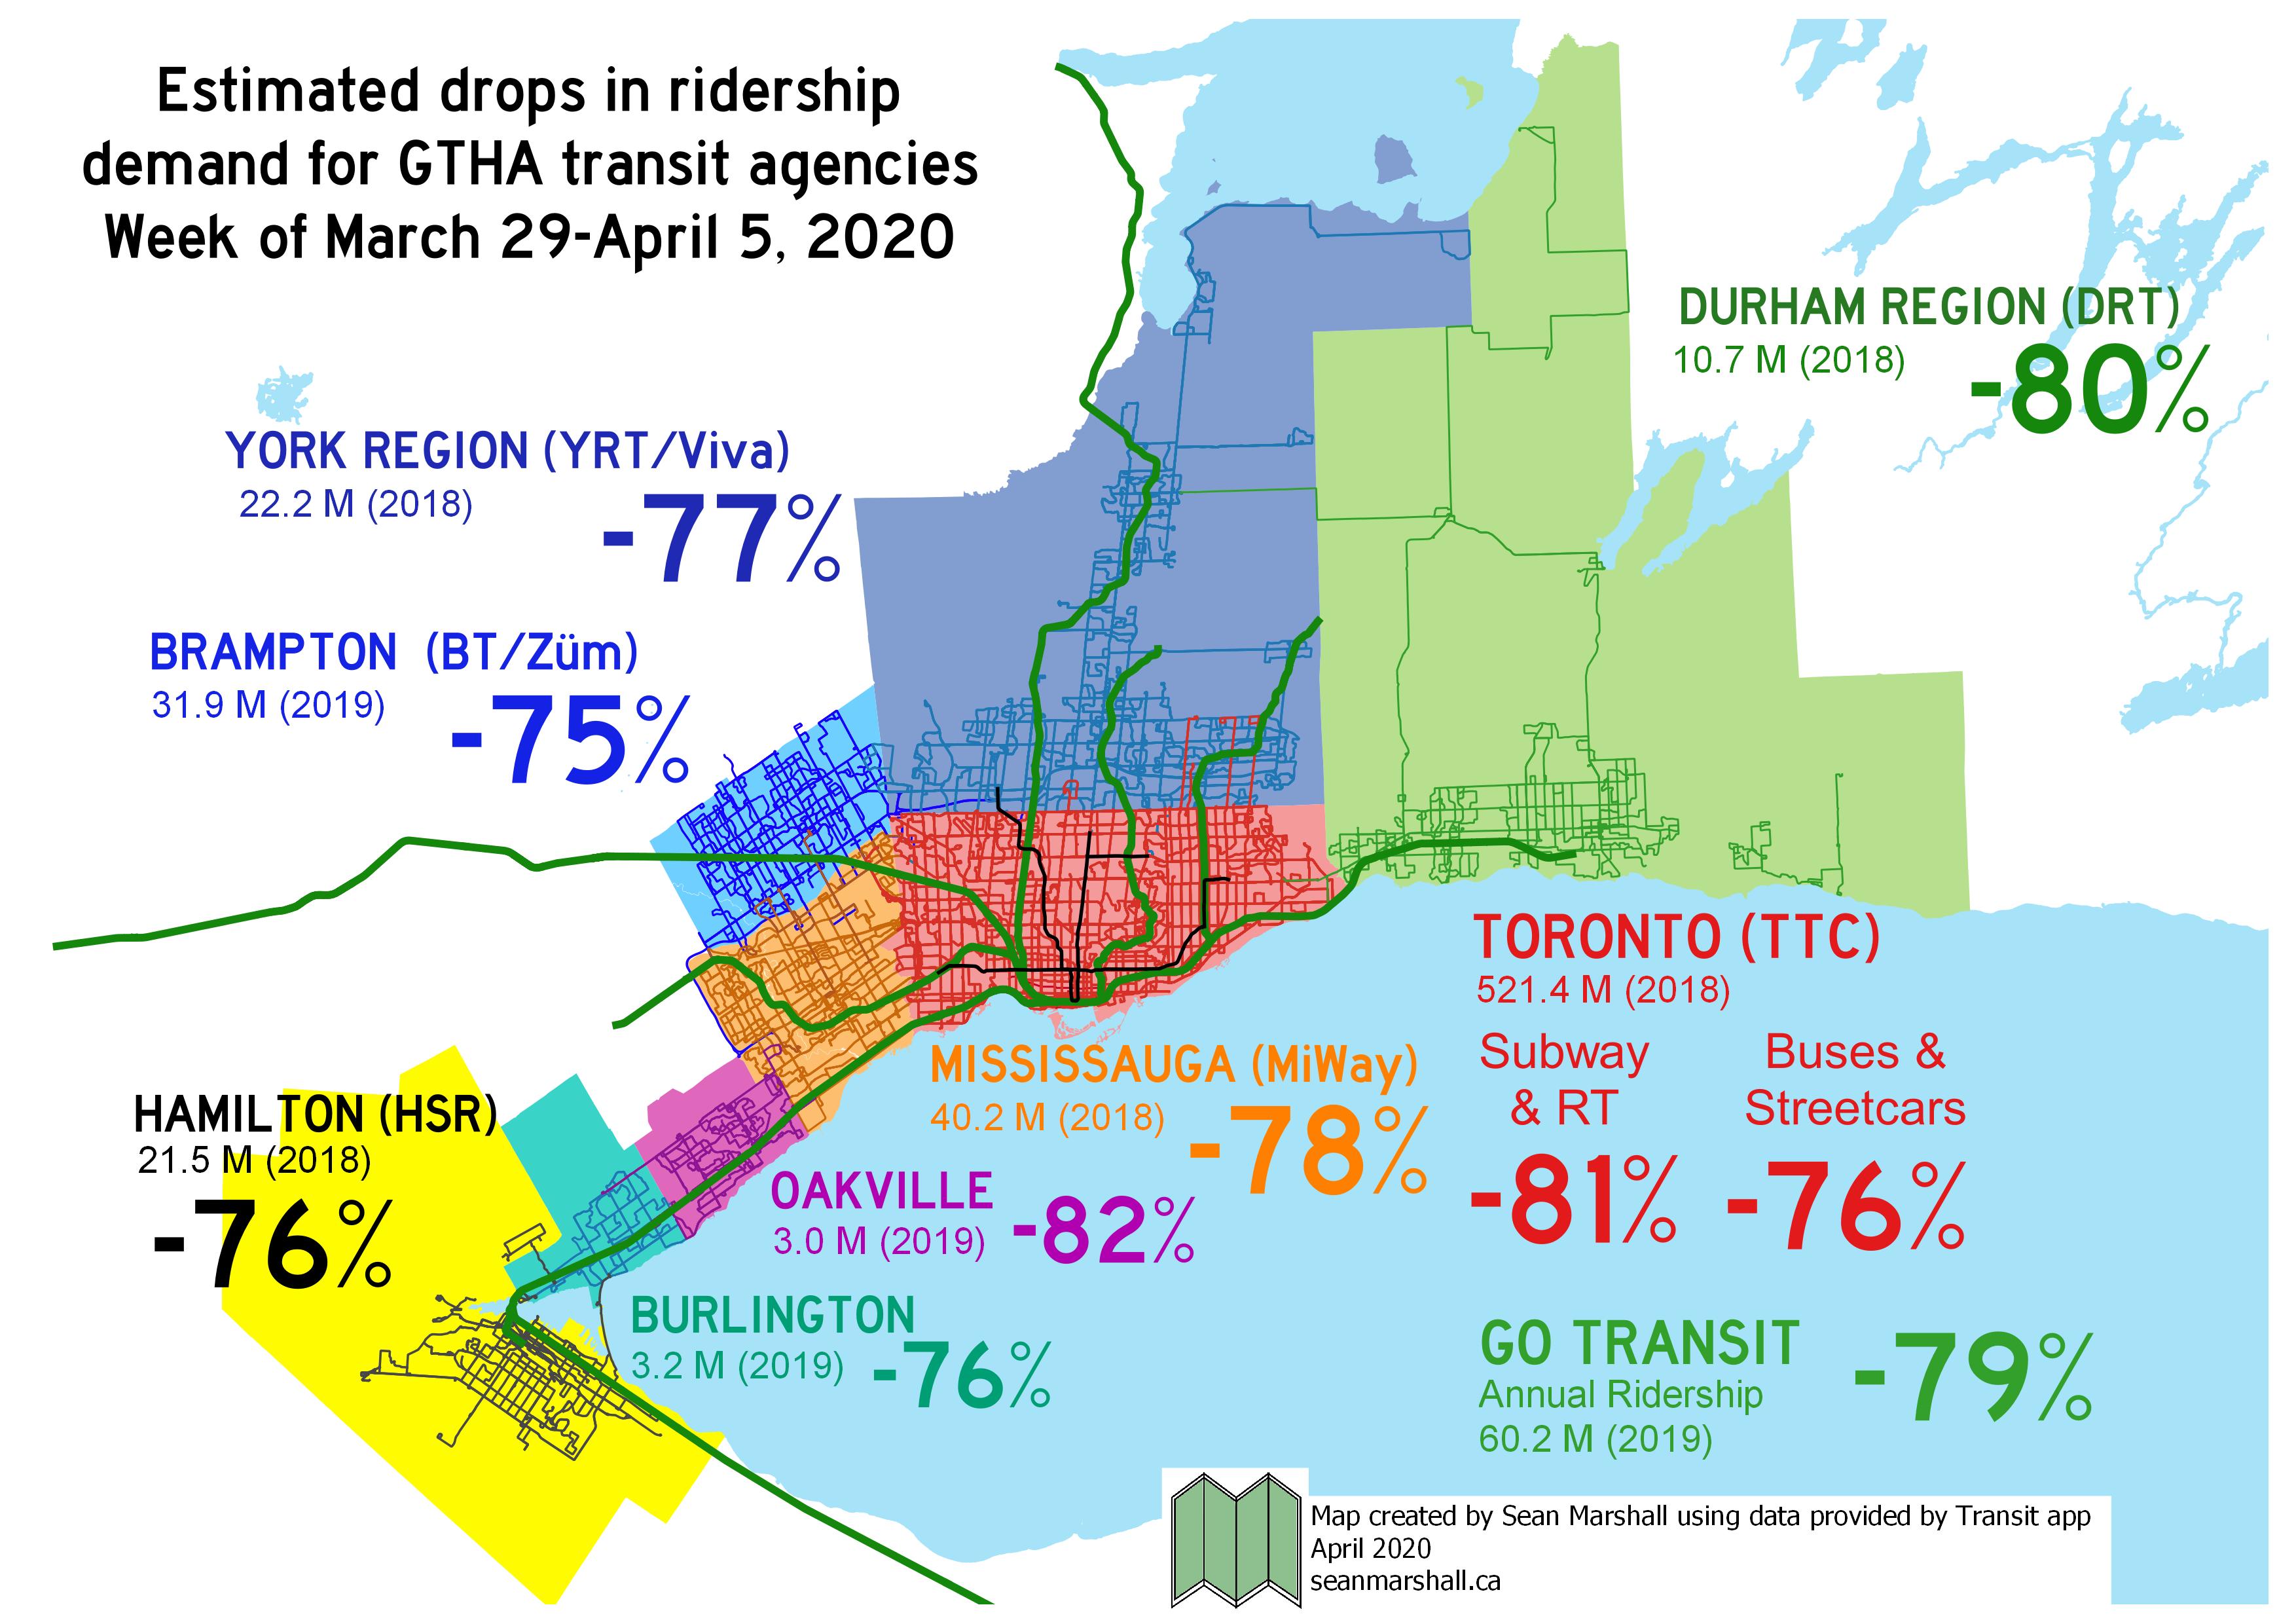
Brampton Transit had the lowest estimated reduction in demand, at -75%. This could be for the same reasons that several bus routes in Toronto saw crowding despite a system-wide drop in ridership. Brampton’s population is relatively lower-income than many other suburban municipalities in Halton, Peel, and York Regions. Brampton also has many large food processing employers, such as Maple Lodge Farms, and many warehouses and distribution centres, including two major Amazon Fulfillment Centres. Brampton Transit connects to other major manufacturing and logistics employment areas in Mississauga, Vaughan and Toronto, including Pearson Airport.
Oakville Transit had the greatest drop, which can be explained by two factors. The first is that Oakville, is a relatively more affluent municipality, with fewer logistics and food industry employers. Secondly, its bus network is designed entirely to connect with GO Transit’s Lakeshore Line, which feeds Downtown Toronto. Therefore, the ridership dependent on Oakville Transit is more likely to be working from home than Brampton’s.
It must be noted that Transit’s figures are not the same as detailed ridership numbers collected by each transit agency. For example, Metrolinx cited a 90% drop in ridership across the GO Transit train and bus network, compared to Transit’s 79% estimate drop. Nonetheless, Transit’s data is a valuable metric.
With the sudden drop in ridership, there’s also a sudden drop in revenue. While many systems, including Brampton Transit and GO Transit have made service reductions, they have been careful to ensure enough capacity remains to safely meet demand. Every system has also increased vehicle and station cleaning, and most have stopped collecting fares to protect both passengers and operators. Just like laid-off employees, students, and freelance workers, transit too will need a bailout of some kind to rebuild lost ridership and maintain safe and healthy services.
Transit projects such as the Eglinton-Crosstown LRT, the new relief transit service for central Toronto (be it the Relief Line or Ontario Line), and GO Transit expansion must go on, as does the progress made in building ridership at suburban systems such as Brampton and Durham Region.

Leave a comment