Tag: Wards

  • Wards and ridings: not quite representation by population

    Wards and ridings: not quite representation by population

    When Statistics Canada released the first batch of 2021 Census data, it made the new population counts available for a wide variety of geographies, from provinces and cities, to local census tracts and even city blocks. It also released data for the 338 federal electoral districts, better known as ridings.

    Because of constitutional requirements, the seats in the federal House of Commons are not allocated equally by population. For example, Prince Edward Island, with a population of 154,331, has four seats. At the other extreme, four electoral districts in Alberta and one in Brampton, Ontario have larger populations than Canada’s smallest province.

    Electoral DistrictProvince/Territory2021 Population
    LabradorNewfoundland & Labrador26,655
    EgmontPrince Edward Island35,925
    NunavutNunavut36,858
    CharlottetownPrince Edward Island38,809
    MalpequePrince Edward Island39,731
    Average109,444
    Banff-AirdrieAlberta155,580
    Calgary SkyviewAlberta159,642
    Brampton WestOntario162,353
    Calgary ShepardAlberta163,447
    Edmonton-WetaskiwinAlberta209,431

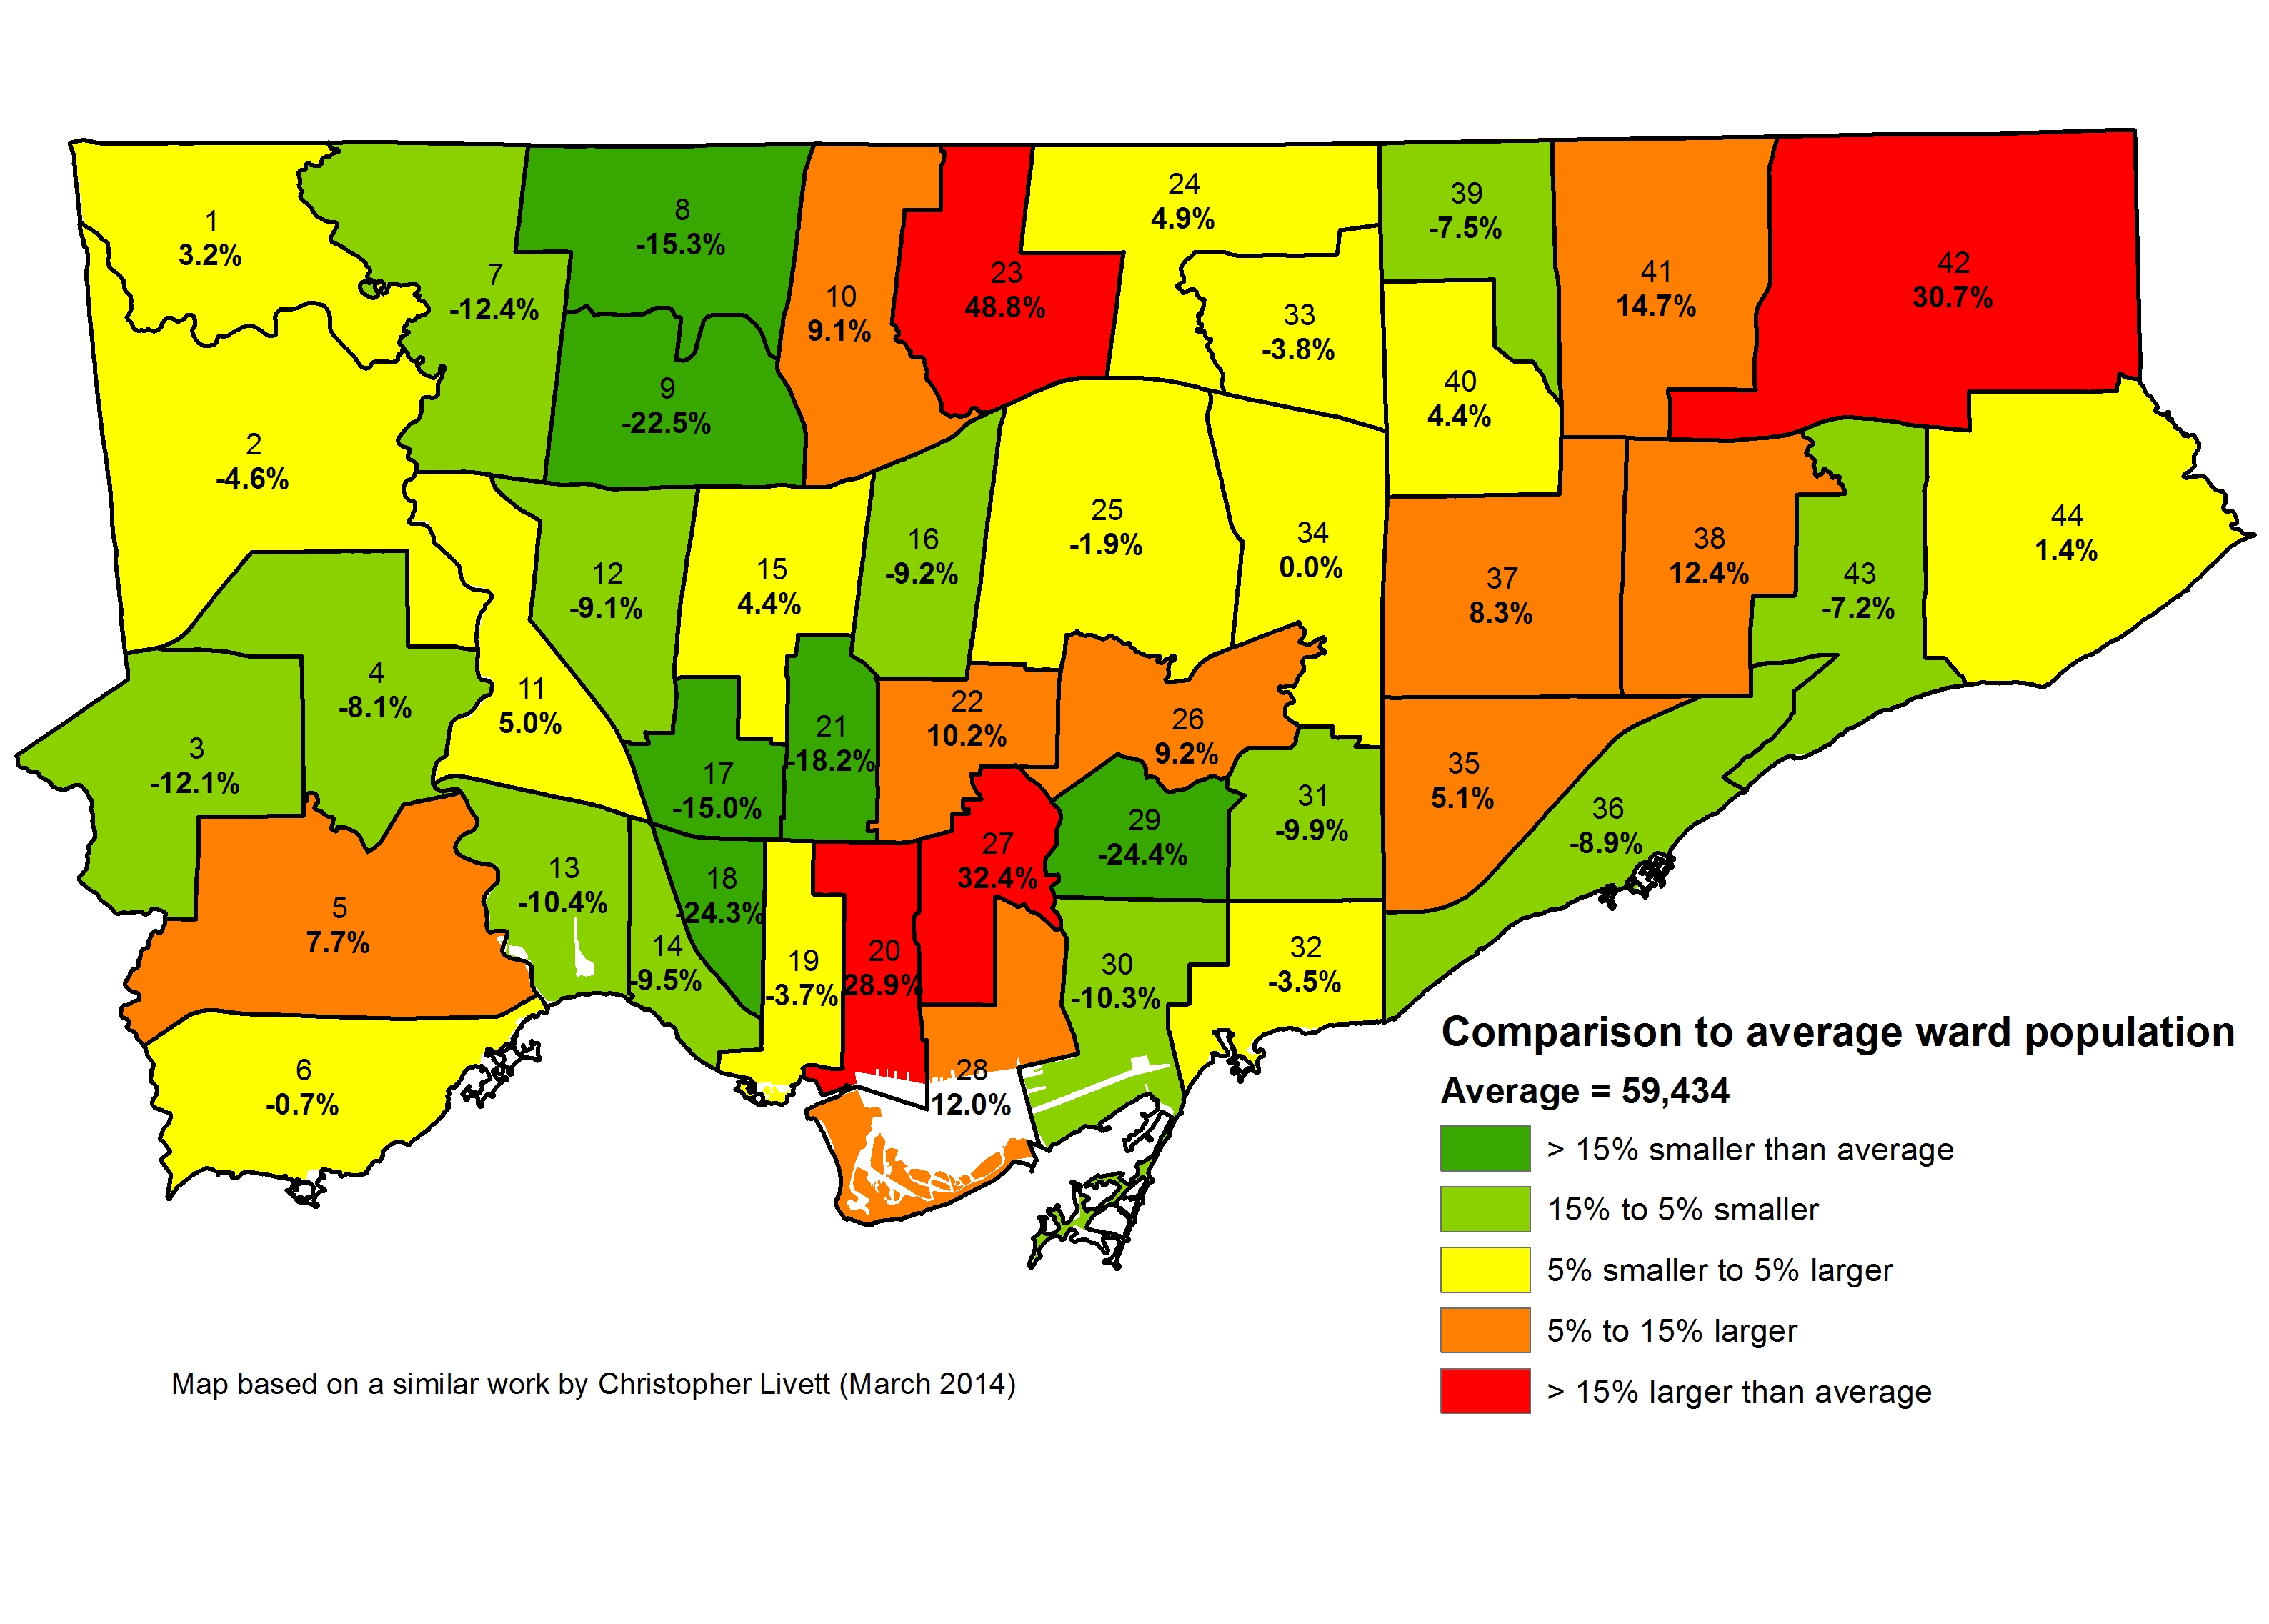
    The federal electoral districts were last drawn in 2013, following the 2011 census. As a result, fast-growing ridings, particularly in Southern Ontario, Calgary, and Edmonton, have huge populations compared to the national average.

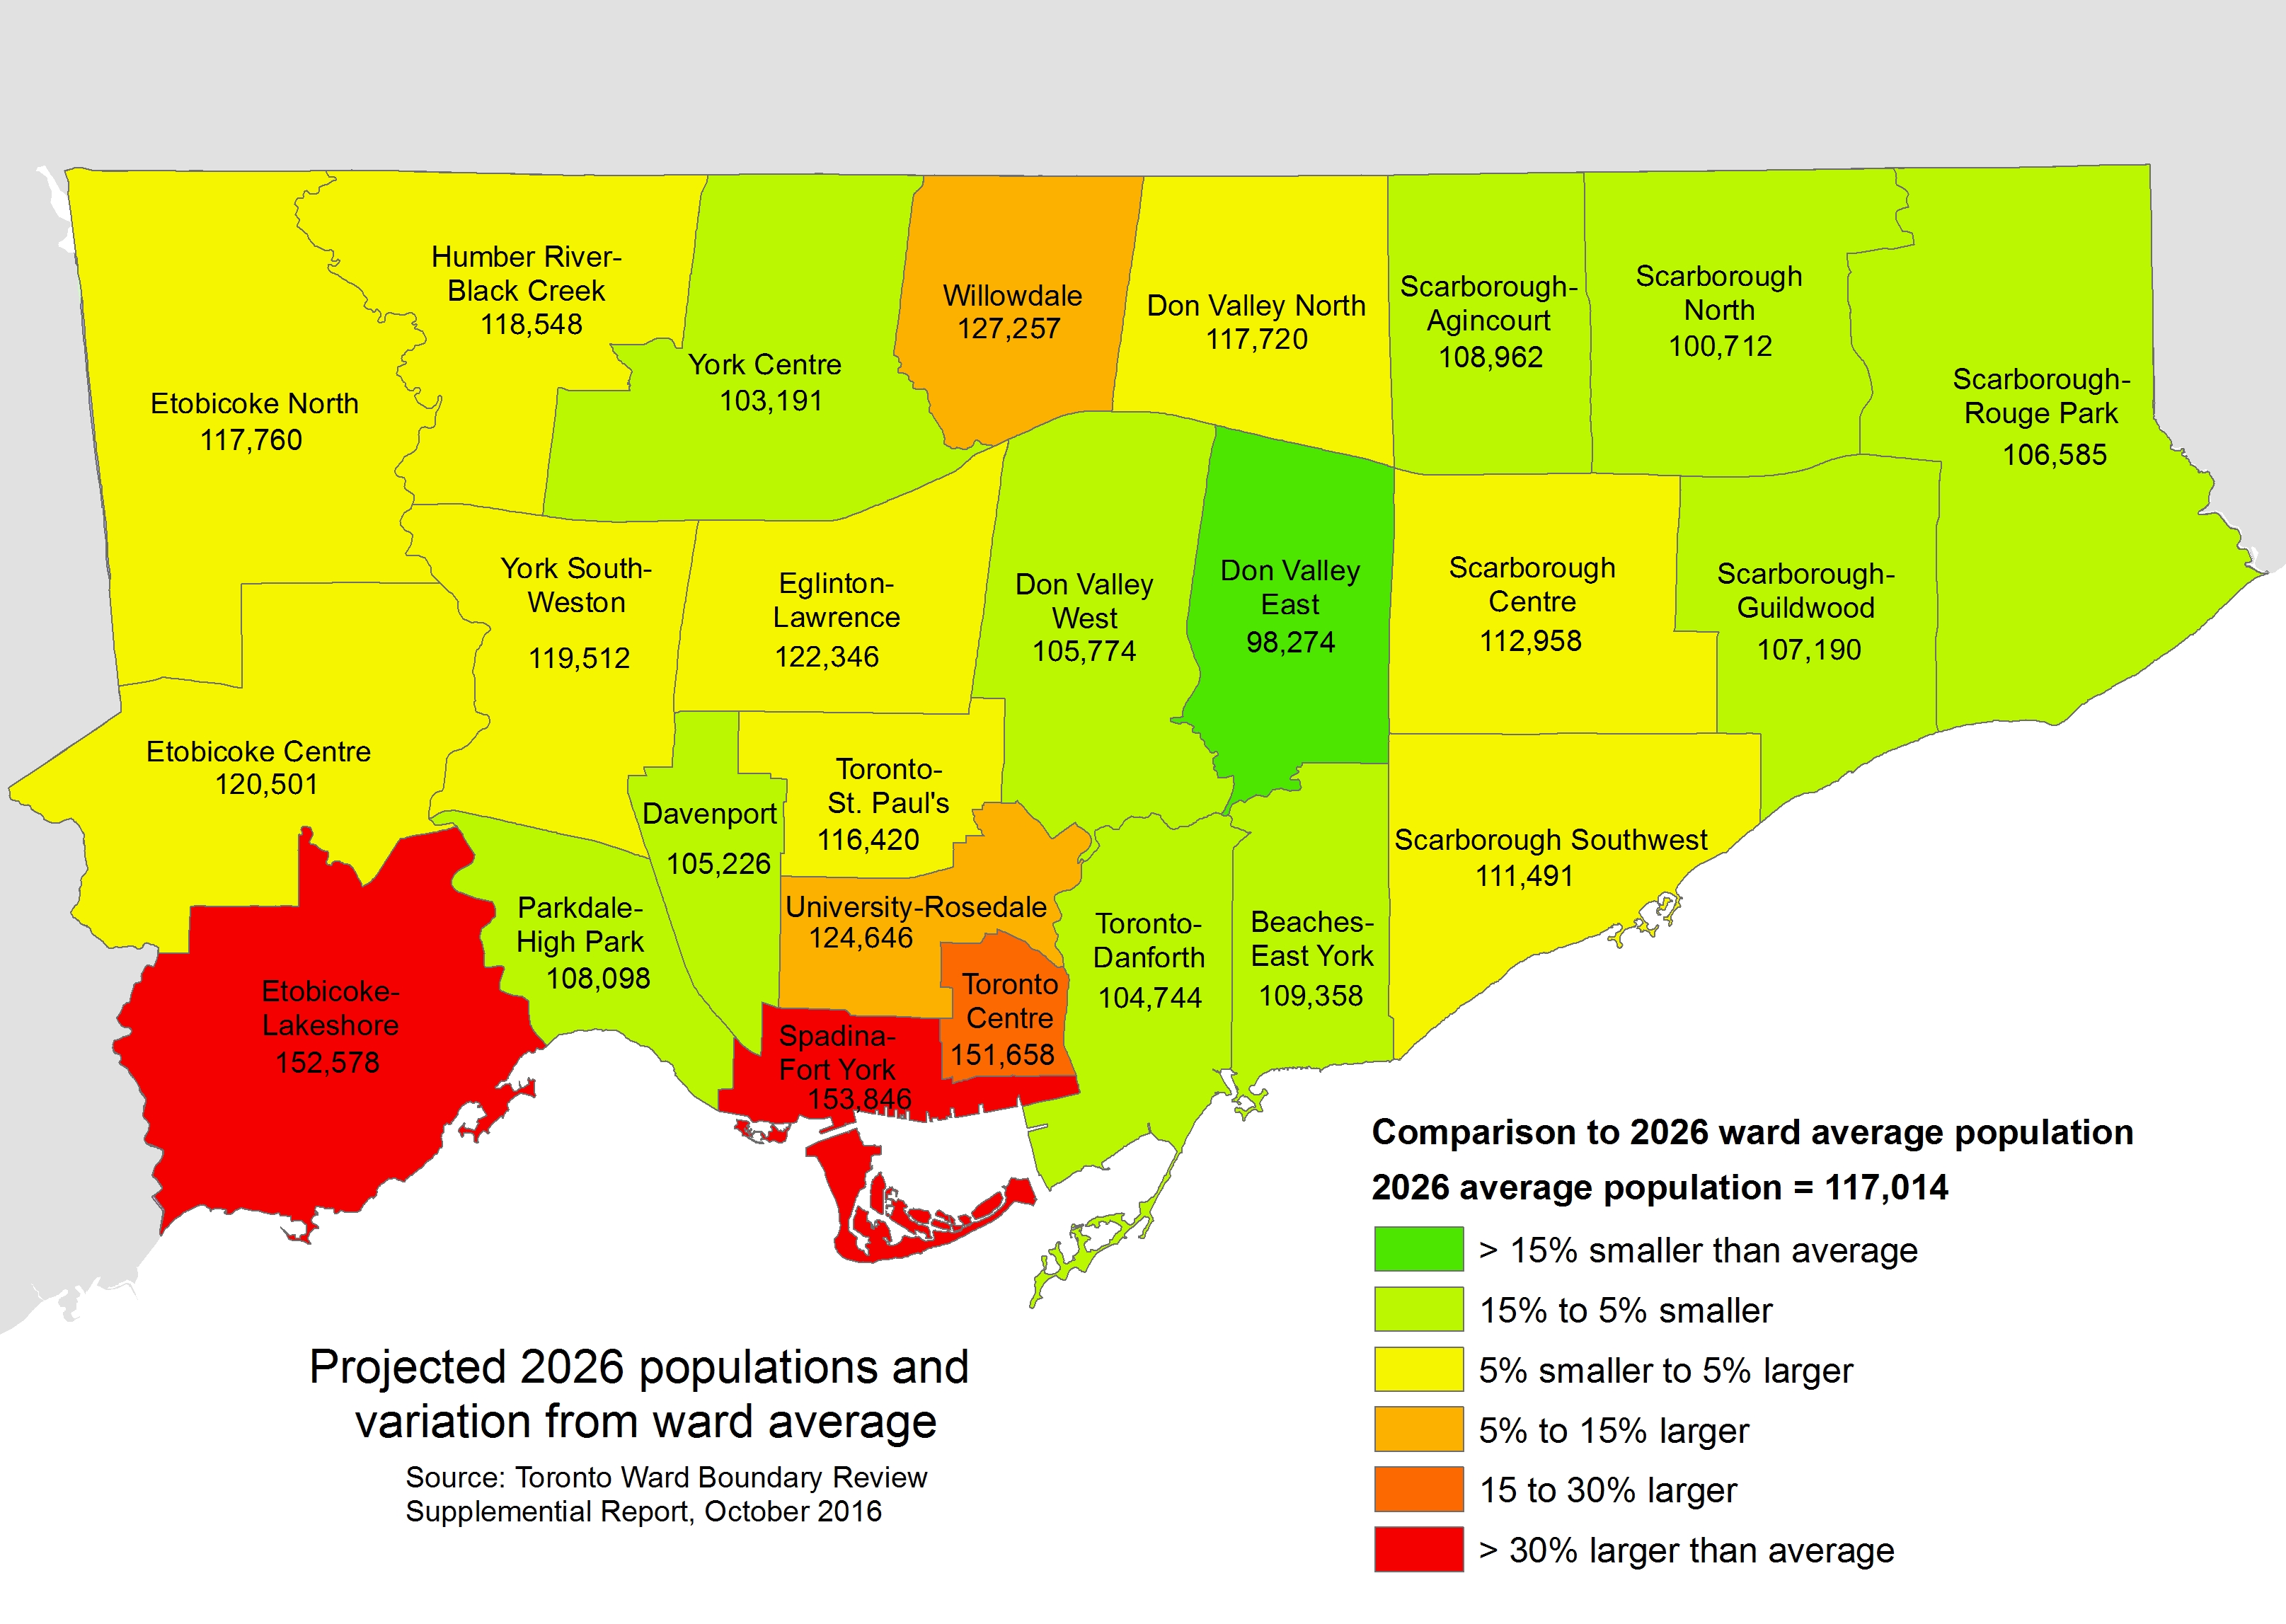
    In Ontario, the provincial government uses the same boundaries for its provincial electoral districts, with the exception of Northern Ontario, where two additional seats help to compensate for the area’s vast and remote regions, where local MPPs may have to travel hours by car, train, or plane to meet constituents. The province imposed the same boundaries on the City of Toronto in 2018, in the middle of a municipal election for which new, fairer boundaries were just approved.

    By 2021, the population differences based on decade-old data became stark, as shown in the map below.

    Map depicting disparities in Toronto’s ward populations

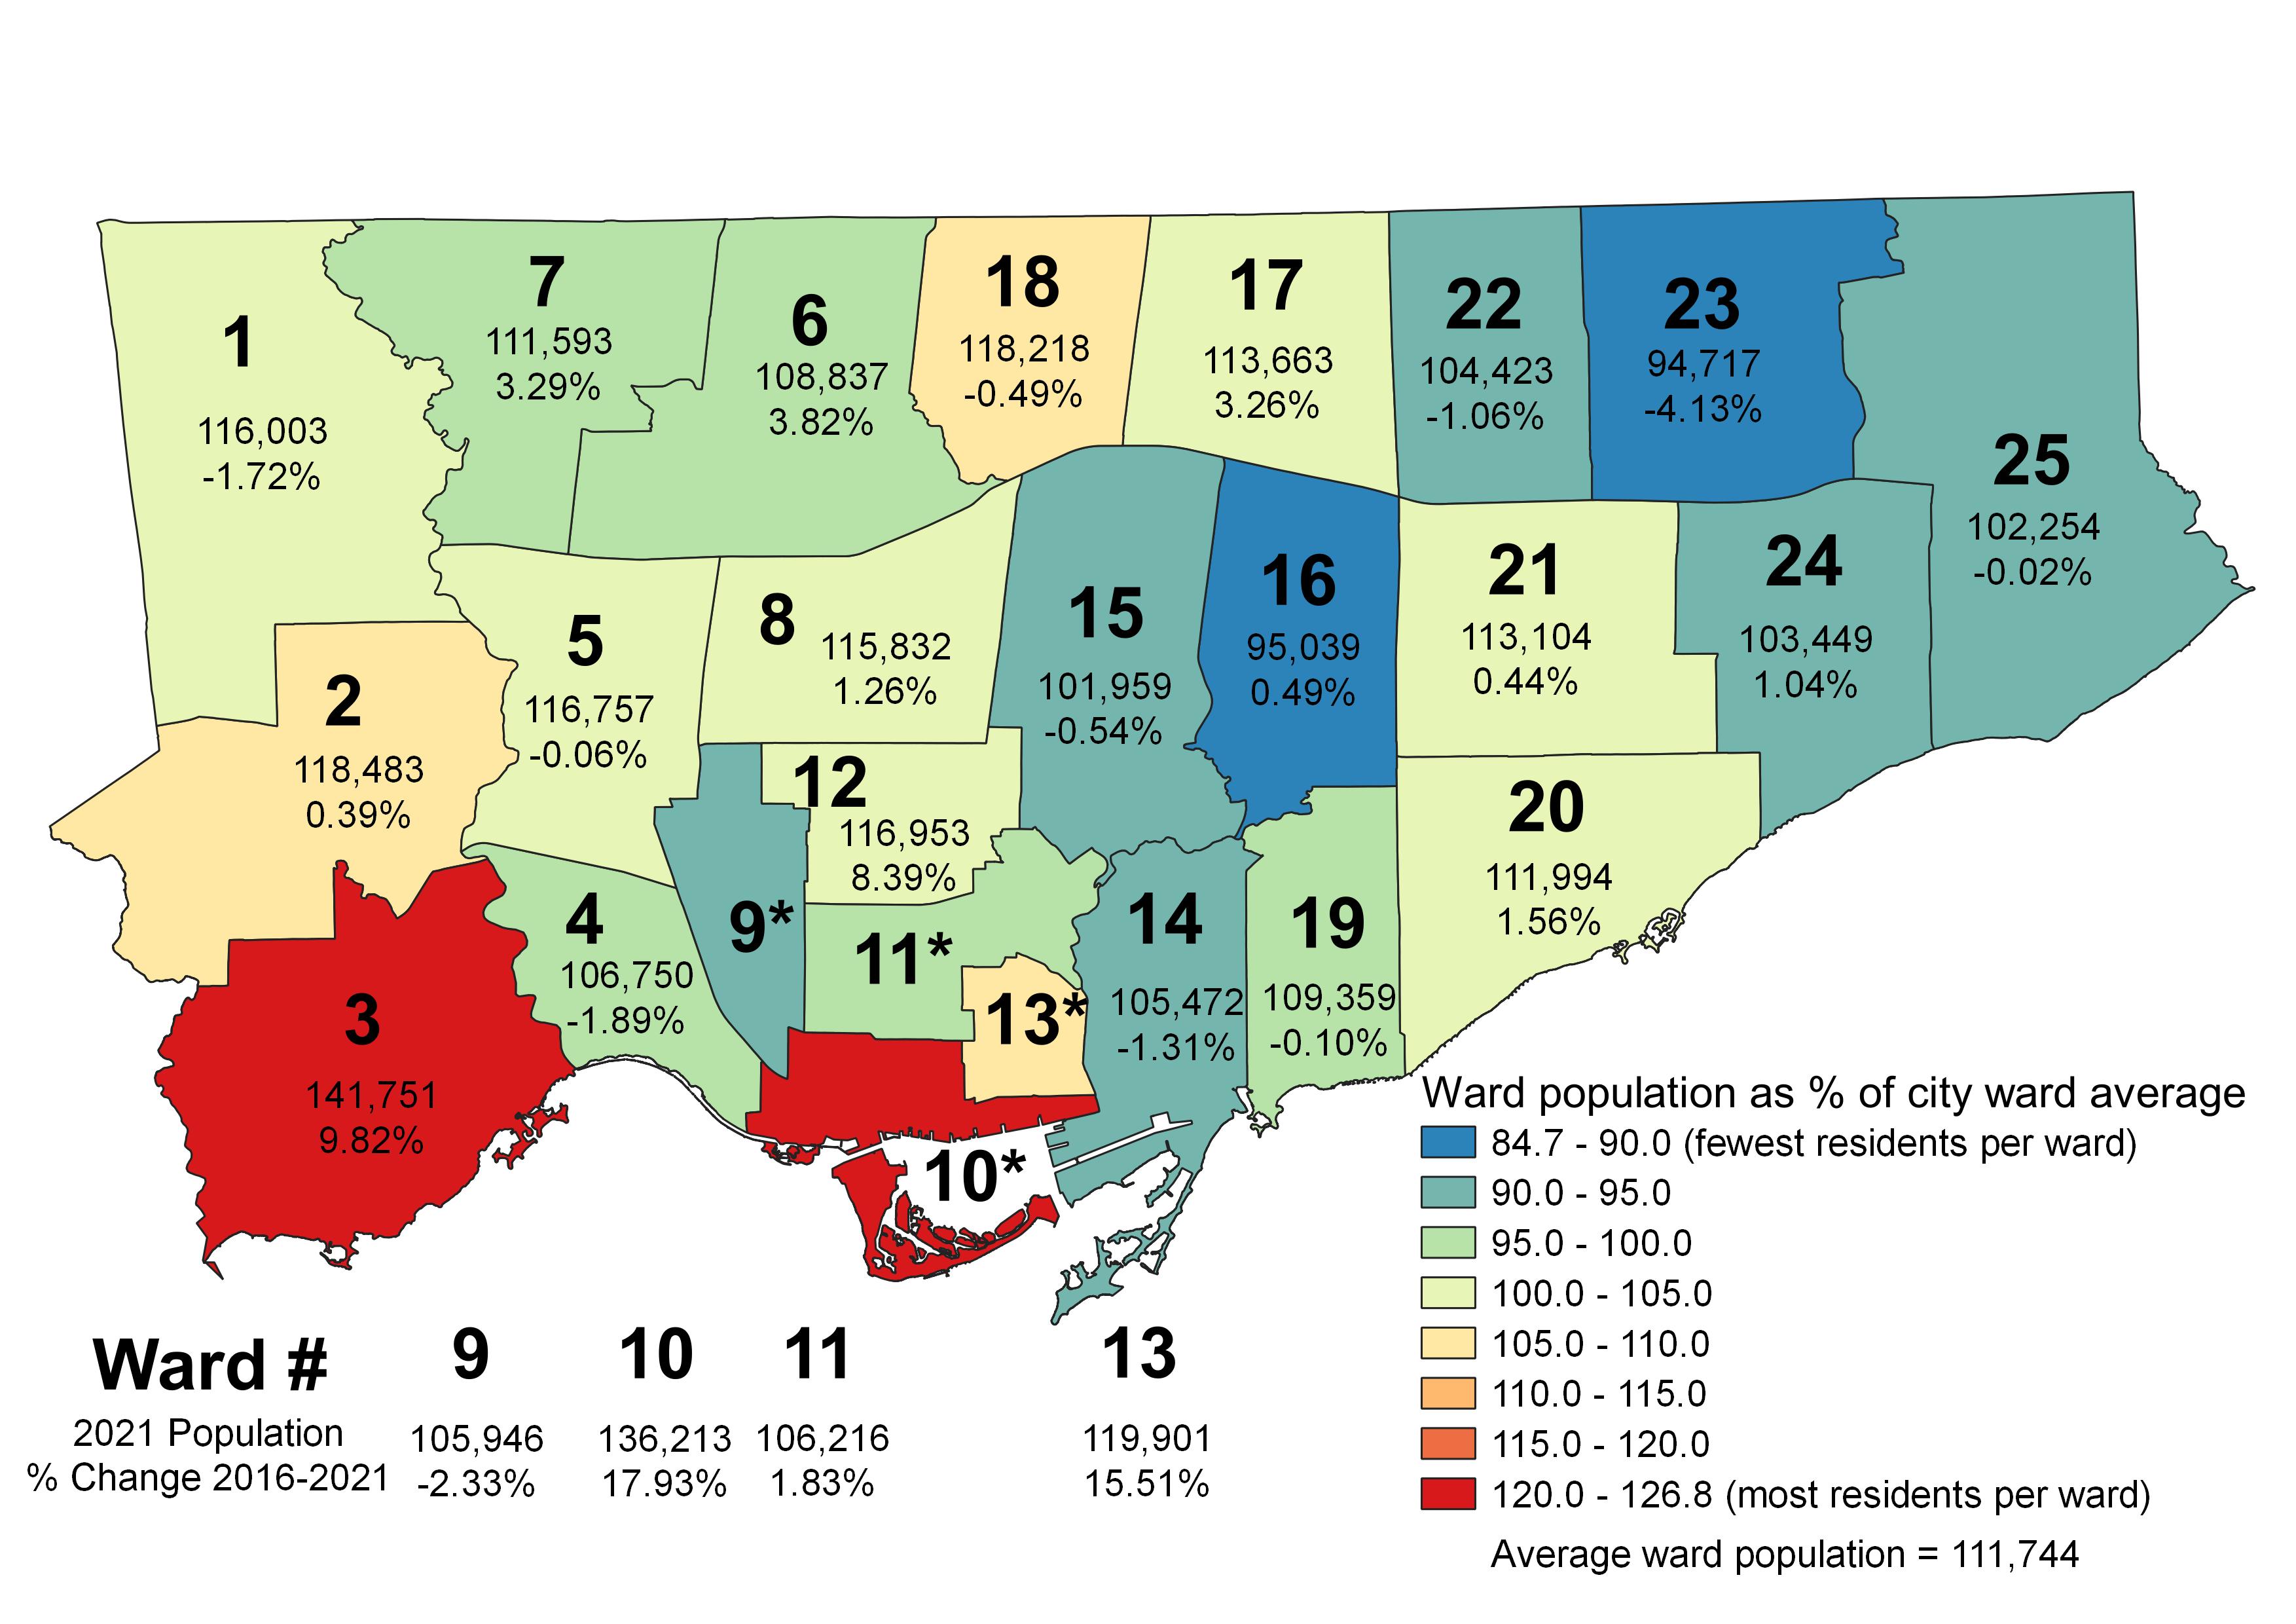
    Ward 23 Scarborough North, represented by Cynthia Lai, has a population of 94,717. Ward 23’s population dropped by over 4% since 2016, as households age and few new housing units built in that ward. Ward 16, Don Valley East, has just 95,039 residents, with a stable population.

    On the other extreme, Ward 3 Etobicoke-Lakeshore, represented by veteran councillor Mark Grimes, has a population of 141,751, growing by 9.82% since 2016. New condominium developments in the Humber Bay neighbourhood and along the Queensway have driven much of that growth. Ward 10, Spadina-Fort York, saw an even greater number of new residents move in, growing by nearly 18% in the last five years.

    As Toronto is stuck with these ward boundaries until 2026, the population disparities will only grow larger, with downtown and South Etobicoke residents becoming even more underrepresented. Compounding the unfairness is that councillors representing high-growth wards have much higher workloads, as they deal with mountains of planning applications while ensuring their existing constituents have access to essential local services like schools, transit, and park space.

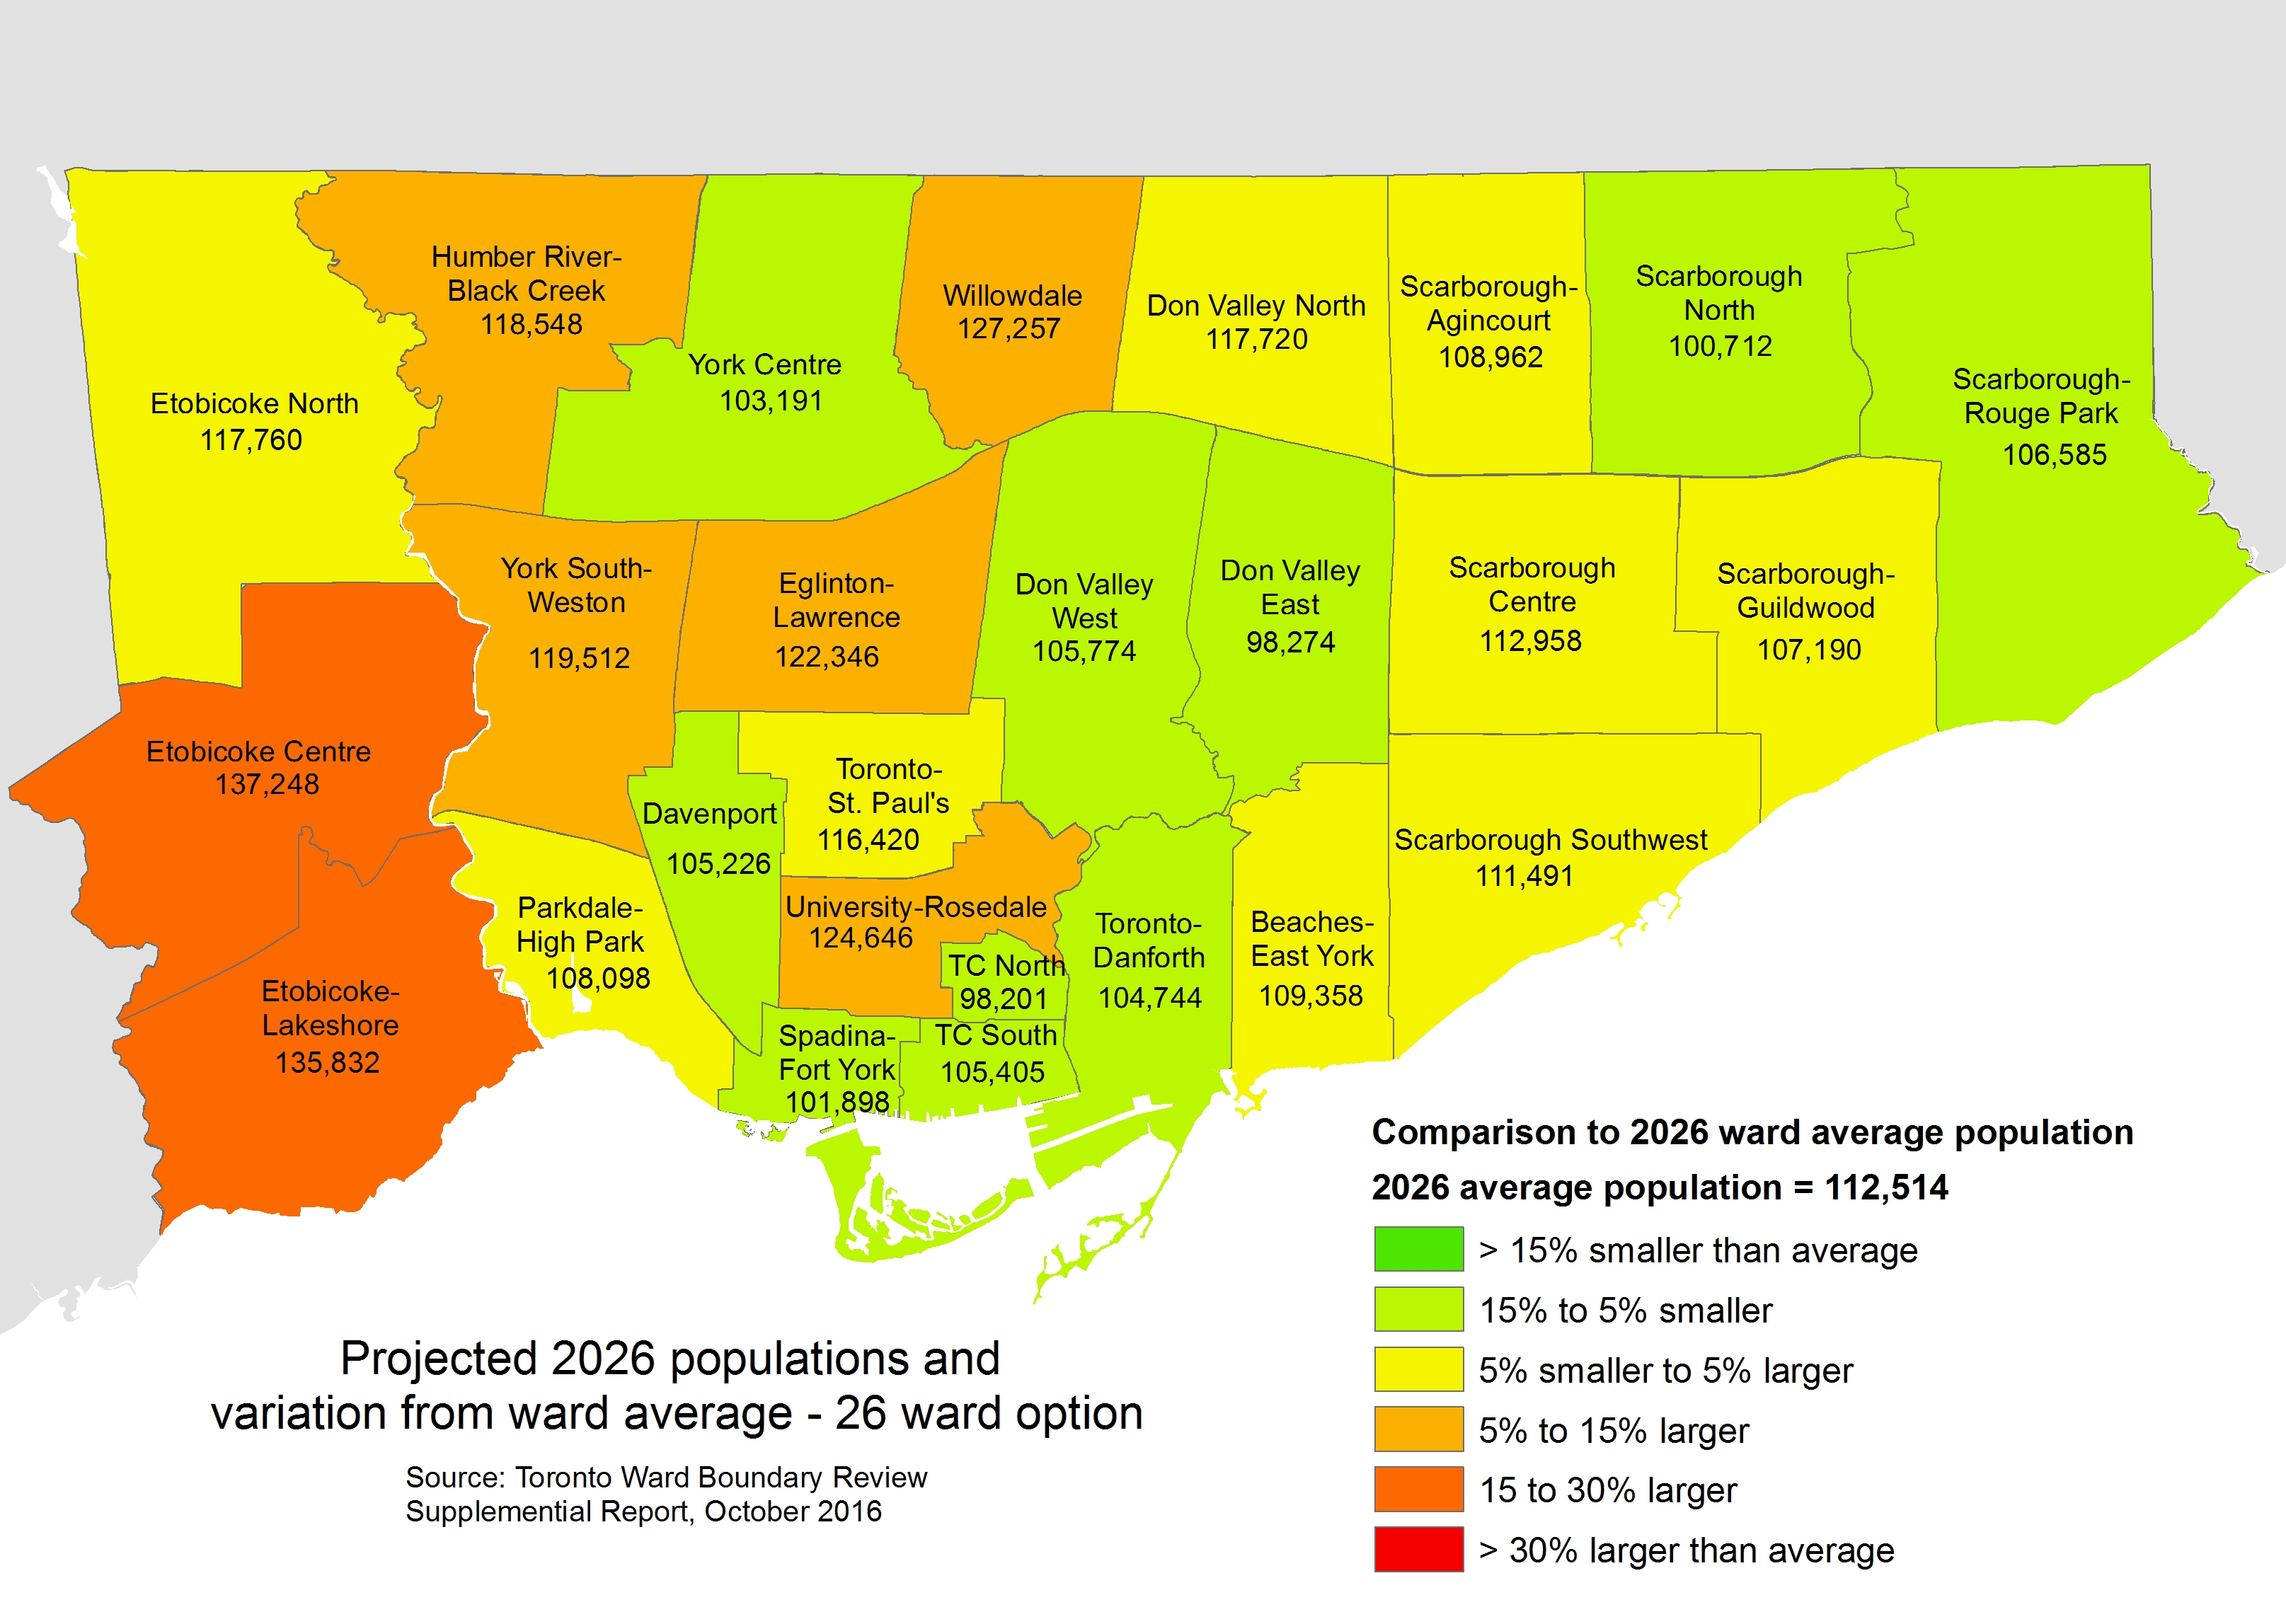
    The ward boundaries initially set for the 2018 municipal election would have accounted for future growth, ensuring that workloads would be more fairly distributed, and that city residents would have equal access to their local councillor.

    The 2021 population counts will be used to set new federal riding boundaries, which will be drawn next year after a consultation period and used in the first federal election held after 2023. The province will likely adopt the new boundaries for the 2026 election (assuming a majority government is elected in June).

    Perhaps in four years, Toronto will be able to set its own ward boundaries again. That, of course, will depend on electing a better provincial government and a council committed to equity and good governance.

  • Why Doug Ford’s plan for 25 Toronto wards is an attack on local democracy

    Ridings and 47 Wards.jpgMap of Doug Ford’s proposed 25 wards and the City Council-approved 47 ward boundaries

    Late last week, the newly elected Ontario Progressive Conservative government announced that they would be imposing a new electoral map on the City of Toronto, a decision that would eliminate the new 47 wards approved by Toronto City Council, replacing them with the same 25 boundaries used by the federal and provincial governments.

    It’s very clear that Premier Doug Ford’s plan, which requires a new piece of legislation, ironically titled the “Better Local Government Act,” is vindictive and mean-spirited because it only affects the City of Toronto, which rejected Doug Ford’s 2014 mayoral bid. It quashes the hopes of many young, racialized, and progressive candidates looking to change the make up of a council that has generally supported Mayor John Tory’s agenda. It is unfair to candidates that ran in good faith, started campaigns, raised funds, and spent money hiring staff, purchasing materials, and renting campaign offices.

    But most of all, Ford’s actions are an attack on local democracy because of the haste with which they are being made, at the end of the nomination period for those approved 47 wards. They ignore the years of study by independent experts and several rounds of public consultations. They also benefit Toronto’s suburban areas, which are growing at a far slower rate than downtown Toronto, North York Centre and Etobicoke’s waterfront area, which will be disproportionately affected by this arbitrary decision.

    Each new ward was designed to have an average population of 61,000, with a population range of between 51,800 and 72,000 (+/- 15%). They were designed to last for four election cycles, to be re-drawn before the 2034 election.

    It is worth noting that the independent experts looked at using the 25 federal/provincial boundaries twice. In the first study, they were rejected early on because they would not “meet the tests of effective representation.” The federal boundaries, which are also adopted by the province of Ontario, are based on population counts from the 2011 Census, and are already seven years out-of-date, while the consultants were tasked with developing new ward boundaries to last 16 years. Even a 50-ward solution (which mimics the old 44 wards based on the 22 federal ridings that were established in 1996 and came into effect with the 1997 federal election) would result in severe variations in population.

    Ridings and 2026 pop variation.jpgHow the 25 ridings, if used for Toronto’s ward boundaries, will vary in population by 2026

    After Tory’s Executive Committee tasked the Toronto Ward Boundary Review team to re-examine options that would see fewer than 47 councillors elected in 2018, they re-examined using the 25 ward boundaries. They found that in 2026, three of those wards — Toronto Centre, Etobicoke-Lakeshore, and Spadina-Fort York — would have populations over 30% higher than the ward average in 2026. Willowdale and University-Rosedale would also have had much larger populations than the city average.

    The review team also looked at a 26-ward option that mostly maintained the riding boundaries but added a new ward downtown out of the Toronto Centre and Spadina-Fort York constituencies and adjusted boundaries in southern Etobicoke. Even then, Etobicoke Centre and Etobicoke-Lakeshore would still have populations over 20% higher than the city-wide average. Despite making some adjustments for population growth, this option would have not have corresponded with some ridings, and was also not recommended.

    26 Wards and 2026 pop variation.jpgHow the modified 26 ridings, if used for Toronto’s ward boundaries, would have varied in population in 2026

    For those reasons, and to support local representation, the 47-ward solution was once again recommended, and was approved by City Council in November 2016. Councillors Justin Di Ciano (Ward 5) and Giorgio Mammoliti (Ward 7) then appealed the new boundaries to the Ontario Municipal Board, but they were dismissed. The 47-ward solution has survived despite it all.

    Mayor Tory may have brought back decorum to the mayor’s office after an embarrassing period under Doug Ford’s brother Rob, but he has pushed an austerity agenda, and has failed to show leadership on police reform, wasteful infrastructure spending, and safe streets for pedestrians and cyclists. His initial reaction, to call for a referendum on Ford’s plan to cut Toronto’s council, was a characteristically weak response; he was later pushed into supporting a legal challenge by an angry public. Meanwhile, some of Tory’s allies, like Di Ciano, David Shiner, and Glenn De Baeremaeker, support Ford’s actions.

    Ford’s attack on local democracy is an insult to candidates who have already put their names forward for election and launched their campaigns. It undermines the City of Toronto’s legislated responsibility to decide its own ward boundaries. And it will only exasperate existing disparities in council representation.

  • Mapping Toronto’s approved new ward boundaries

    18506683800_6c96dcc66b_k

    On Monday, October 22, 2018, Torontonians will be electing a new city council. And for the first time since 2000, Toronto’s ward boundaries will be changing.

    When the new council is formed on December 1, 2018, there will be 47 wards, up from 44. Downtown Toronto will gain three new seats, and North York will gain one, but one seat is lost in Toronto’s west end, in an area currently represented by Wards 14, 17, and 18. Seven wards in Etobicoke, North York, and Scarborough will remain unchanged.

    Earlier this week, the City of Toronto added the new boundaries to its open data catalogue, so I used the data to create an interactive Google map. This map, embedded below, shows both the current 44 wards, and the approved new 47 wards. Each of the two ward boundary layers can be turned on and off.


    Google map showing current and approved new ward boundaries

    These new ward boundaries are the result of a long four-year study and consultation process, and represent a compromise that improves representation in high-growth areas, while minimizing the loss of council representation elsewhere. Several other options were explored, including reducing the number of councillors to 25, but they were rejected by the consultants hired by the city to draw the new wards; they were also unpopular among members of the public who attended the consultations.

    While Toronto City Council approved the new boundaries in November 2016 (despite Mayor John Tory’s opposition), Councillors Justin Di Ciano (Ward 5) and Giorgio Mammoliti (Ward 7) appealed the new boundaries to the Ontario Municipal Board. Happily, the OMB dismissed the two councillors’ complaints last month. Both councillors are likely to run for re-election in modified versions of their existing wards.

    I will update the interactive map, adding candidate names for each of the new wards. Nominations are open from May 1, 2018 through July 27, 2018.

    Thanks to Gil Meslin (@g_meslin), who altered me to the fact that the new ward boundaries were available on the city’s website. 

  • Why Toronto needs new ward boundaries

    The City of Toronto is in the process of reviewing the ward boundaries. This is an overlooked and much needed initiative. Due to population increases in central Toronto, North York and in Scarborough, parts of the city are unrepresented at City Hall. Some councillors are overworked with development proposals in their wards, while other parts of the city are relatively quiet.

    While some will argue for fewer politicians (the idea has a populist appeal), I would like to see more city councillors, elected by ranked ballot (which Mayor John Tory supports), to best serve the needs of our diverse and dynamic city. Based upon the population from 2011 census, Wards 20, 23, 27, and 42 are the most underrepresented at City Hall; Ward 42 includes the new Morningside Heights neightbourhood, while condominium construction have swollen the number of residents in Wards 20, 23 and 27. Simply put, the boundaries have to be changed to provide more equal representation. Ward representation 2011 census Map of how each ward is under-represented or over-represented in Toronto, map based on one previously created by Christopher Livett

    The city’s review process, which you can find more about here, is being conducted by independent consultants, so far free of political influence. Though the first round of public consultations have already occurred, there will be further opportunity to participate in the development of ward boundary options. There has yet to be a decision as to how many councillors Toronto should have going forward, or what the boundaries will look like. The committee will report to city council in early-mid 2016 with their recommendations, giving plenty of time before the next election, which will be held in October, 2018.

    (more…)